Open Access
Fig. E.1
Download original image
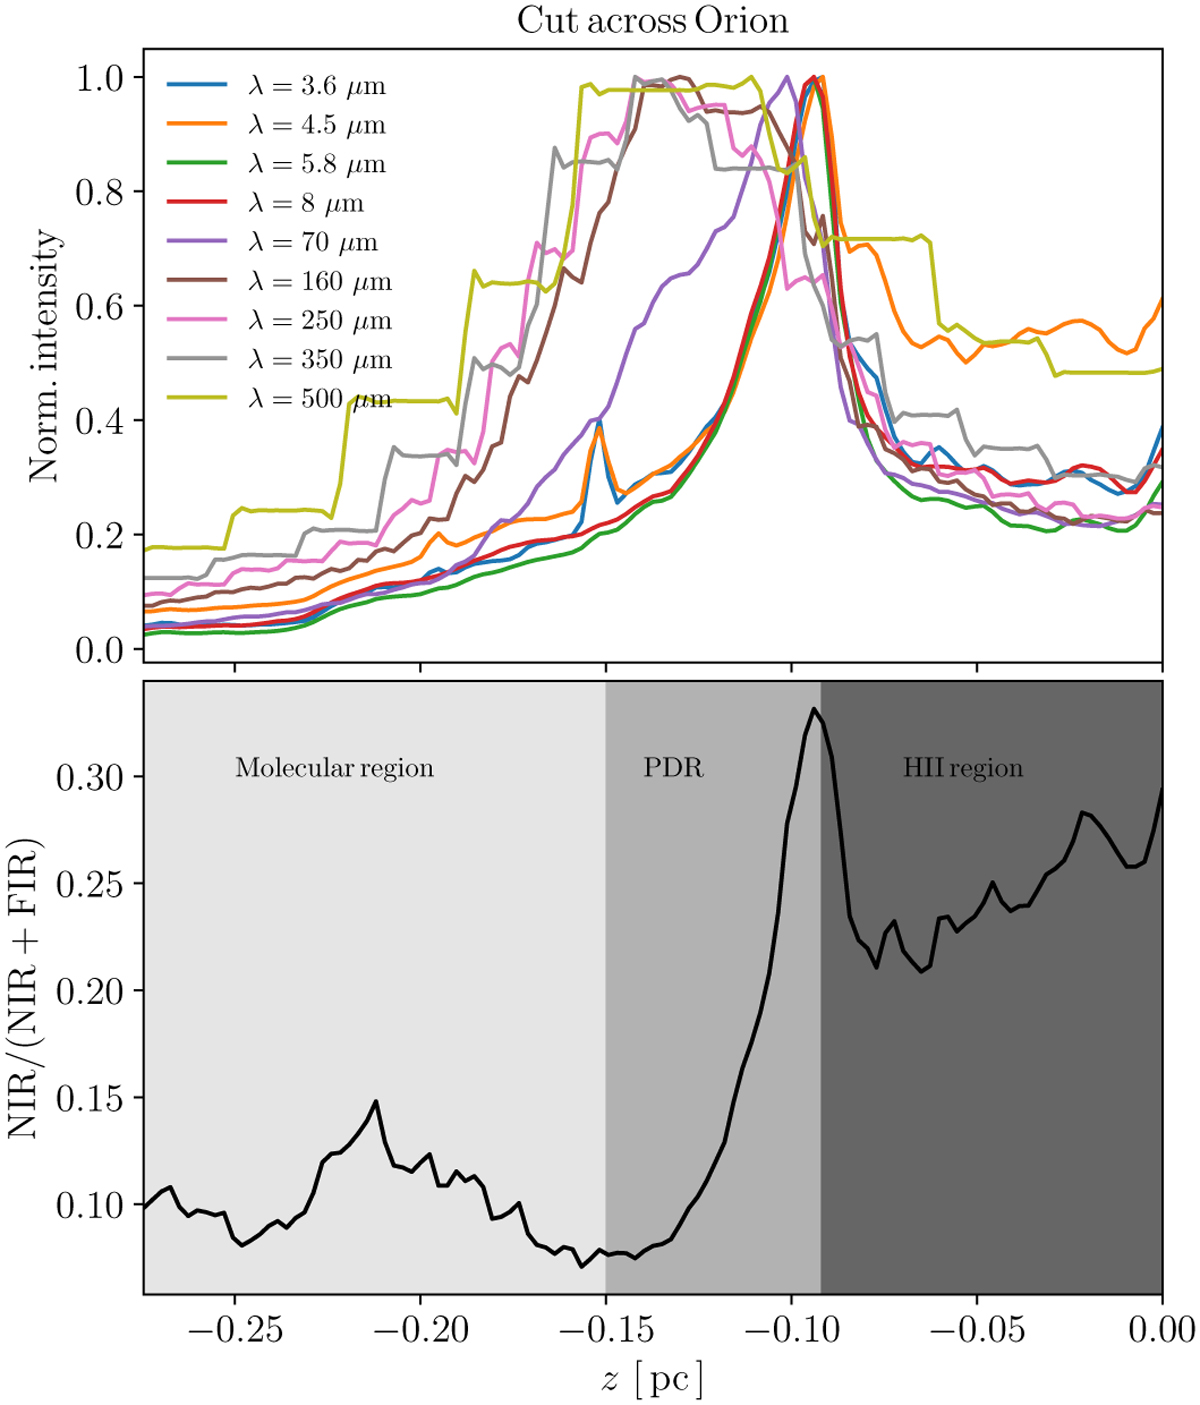
Top: Normalised emission across a selected cut in the Orion Bar (This cut is shown in Fig. 1) in nine photometric bands. Botton: NIR to FIR emission ratio across the Orion Bar. The three different zones correspond to the molecular region, the PDR, and the HII regions respectively.
Current usage metrics show cumulative count of Article Views (full-text article views including HTML views, PDF and ePub downloads, according to the available data) and Abstracts Views on Vision4Press platform.
Data correspond to usage on the plateform after 2015. The current usage metrics is available 48-96 hours after online publication and is updated daily on week days.
Initial download of the metrics may take a while.