Fig. 13
Download original image
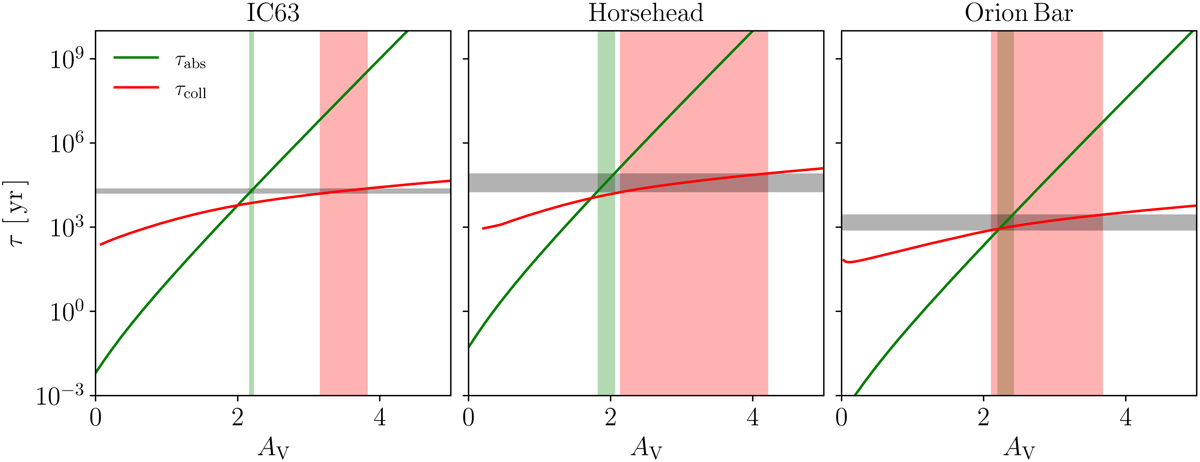
Absorption timescales are represented by the green lines for IC63 (left panel), Horsehead (middle panel), Orion Bar (right panel). Collision timescales between the most abundant aggregates (a0 ~ 0.05 µm) are shown in red lines. The horizontal grey stripes correspond to the advection timescales (see Table 4). The vertical light green (red) stripes correspond to the region where τabs ~ τad (τcoll ~ τad).
Current usage metrics show cumulative count of Article Views (full-text article views including HTML views, PDF and ePub downloads, according to the available data) and Abstracts Views on Vision4Press platform.
Data correspond to usage on the plateform after 2015. The current usage metrics is available 48-96 hours after online publication and is updated daily on week days.
Initial download of the metrics may take a while.