Fig. 12
Download original image
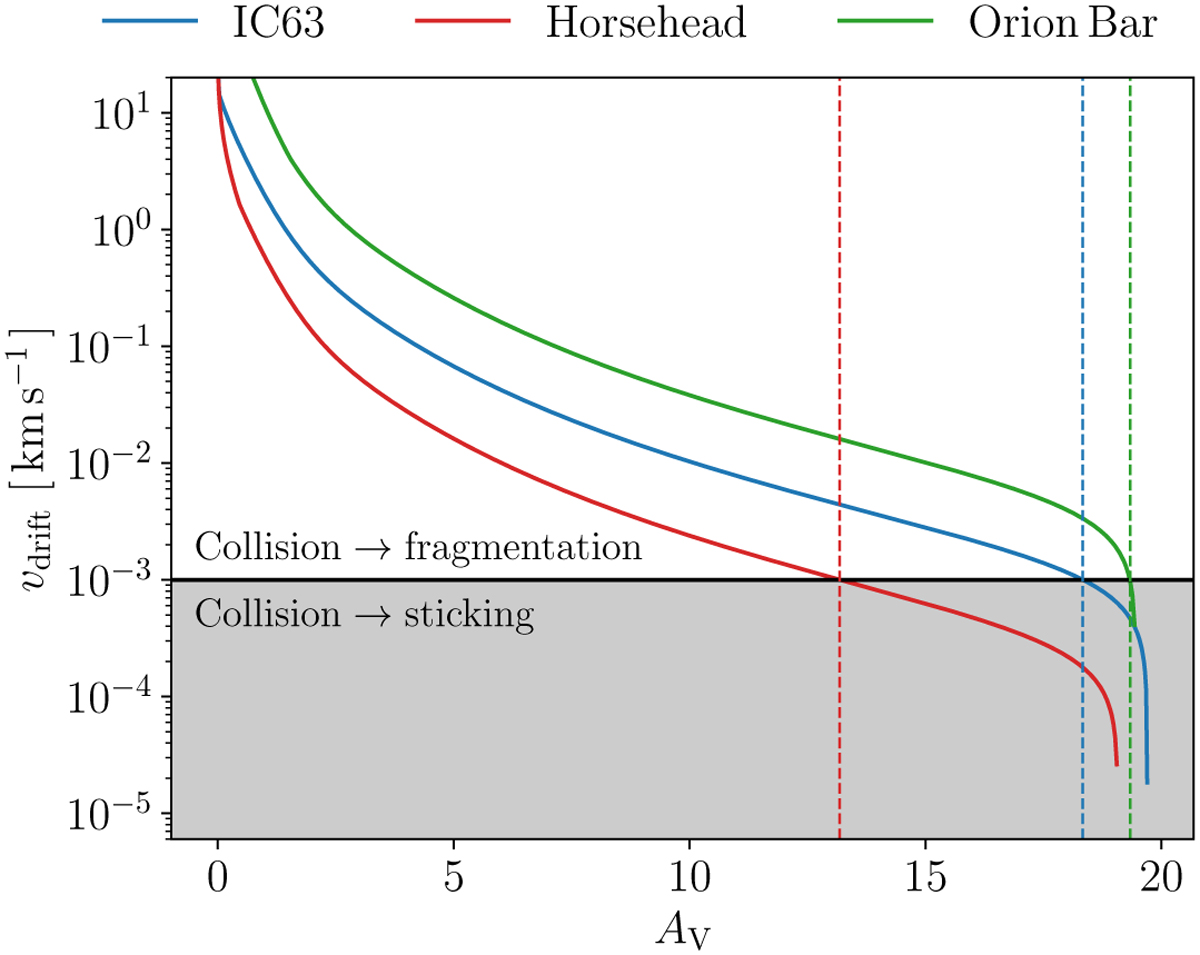
Drift velocity as a function of Av for IC63 (blue line), Horsehead (Red line), and Orion Bar (green line). The horizontal black line corresponds to the velocity threshold above which collisions lead to fragmentation (see Sect. 6.3). The vertical dashed lines correspond to the limit in Av above which the velocity drift is not high enough to generate fragmentation.
Current usage metrics show cumulative count of Article Views (full-text article views including HTML views, PDF and ePub downloads, according to the available data) and Abstracts Views on Vision4Press platform.
Data correspond to usage on the plateform after 2015. The current usage metrics is available 48-96 hours after online publication and is updated daily on week days.
Initial download of the metrics may take a while.