Fig. 2.
Download original image
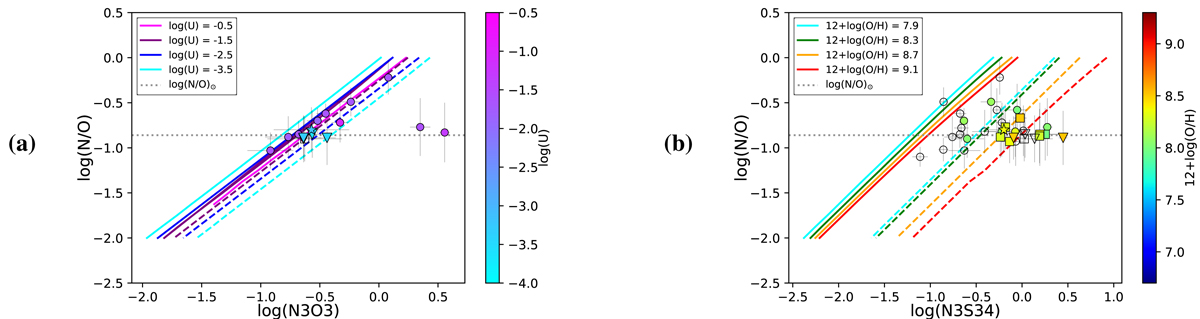
Relations between different IR emission-line ratios with N/O. (a) Relation with N3O3 in our sample. The colorbar shows estimations of log(U). AGN models for a fixed value of 12+log(O/H) = 8.6 are presented as continuous lines, while dashed lines correspond to SFG models for the same fixed value. (b) Relation with the N3S34 estimator in our sample. The colorbar shows estimations of 12+log(O/H). AGN models for a fixed value of log(U) = −2.0 are presented as continuous lines, while dashed lines correspond to SFG models for the same fixed value. For both plots, blank points indicate that no estimation can be provided of the colored quantity. The following spectral types are represented: Seyferts 2 as circles; ULIRGs as squares; LIRGs as triangles; and LINERs as stars.
Current usage metrics show cumulative count of Article Views (full-text article views including HTML views, PDF and ePub downloads, according to the available data) and Abstracts Views on Vision4Press platform.
Data correspond to usage on the plateform after 2015. The current usage metrics is available 48-96 hours after online publication and is updated daily on week days.
Initial download of the metrics may take a while.