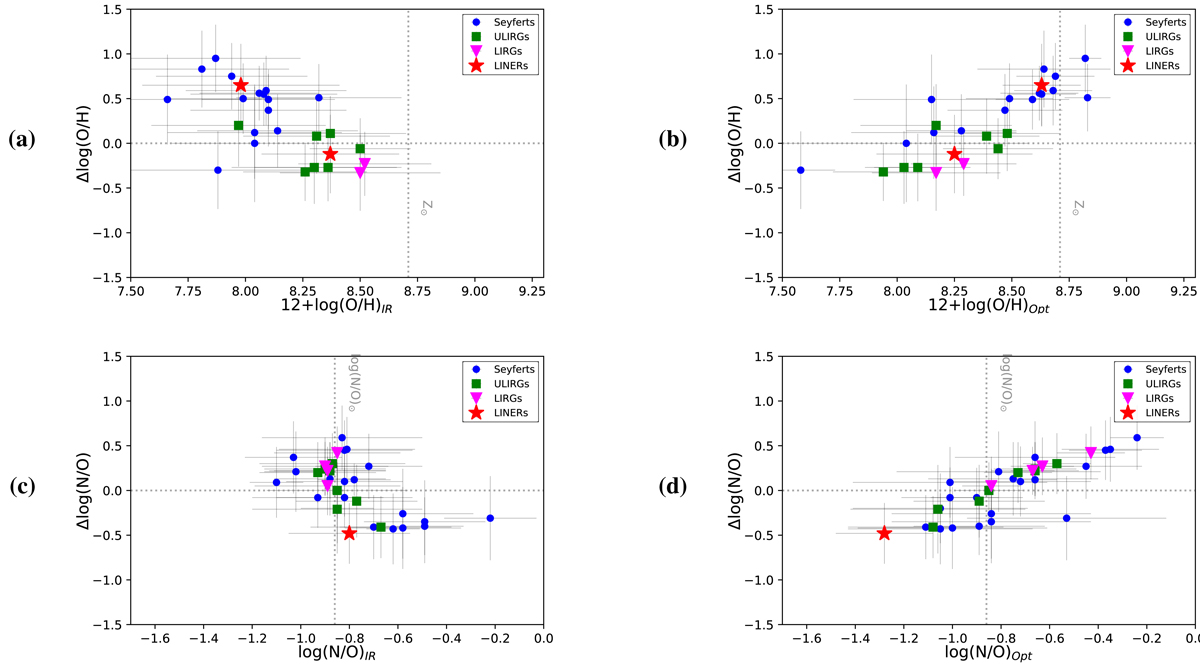
Fig. 13.
Download original image
Discrepancies between the chemical abundance ratios (ΔX = Xopt − XIR) as a function of their ratios: (a) 12+log(O/H) and (c) log(N/O) both derived from IR emission lines with HCM-IR, and (b) 12+log(O/H) and (d) log(N/O) derived from optical emission lines with HCM. For all plots we present Seyferts as blue circles, ULIRGs as green squares, LIRGs as magenta triangles, and LINERs as red stars.
Current usage metrics show cumulative count of Article Views (full-text article views including HTML views, PDF and ePub downloads, according to the available data) and Abstracts Views on Vision4Press platform.
Data correspond to usage on the plateform after 2015. The current usage metrics is available 48-96 hours after online publication and is updated daily on week days.
Initial download of the metrics may take a while.