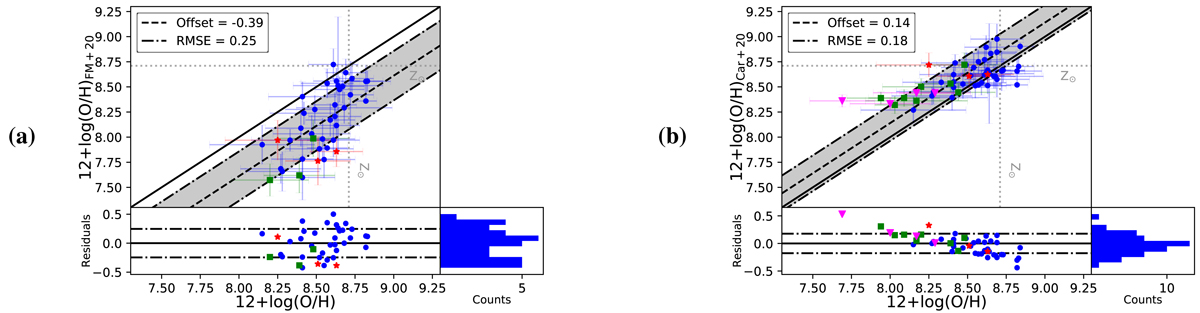
Fig. 10.
Download original image
Chemical abundances derived from optical emission lines in our sample of AGN. (a) Comparison between the chemical abundances derived with the calibration from Flury & Moran (2020; y-axis), denoted as FM20, and HCM (x-axis). (b) Comparison between the chemical abundances derived from the calibration from Carvalho et al. (2020; y-axis), denoted as FM20, with HCM (x-axis). For all plots we present Seyferts as blue circles, ULIRGs as green squares, LIRGs as magenta triangles, and LINERs as red stars. The offsets are given using the median value (dashed line) and RMSE (dot-dashed lines). Bottom plots show the residuals from the offset and their distribution in a histogram (bottom-right plot).
Current usage metrics show cumulative count of Article Views (full-text article views including HTML views, PDF and ePub downloads, according to the available data) and Abstracts Views on Vision4Press platform.
Data correspond to usage on the plateform after 2015. The current usage metrics is available 48-96 hours after online publication and is updated daily on week days.
Initial download of the metrics may take a while.