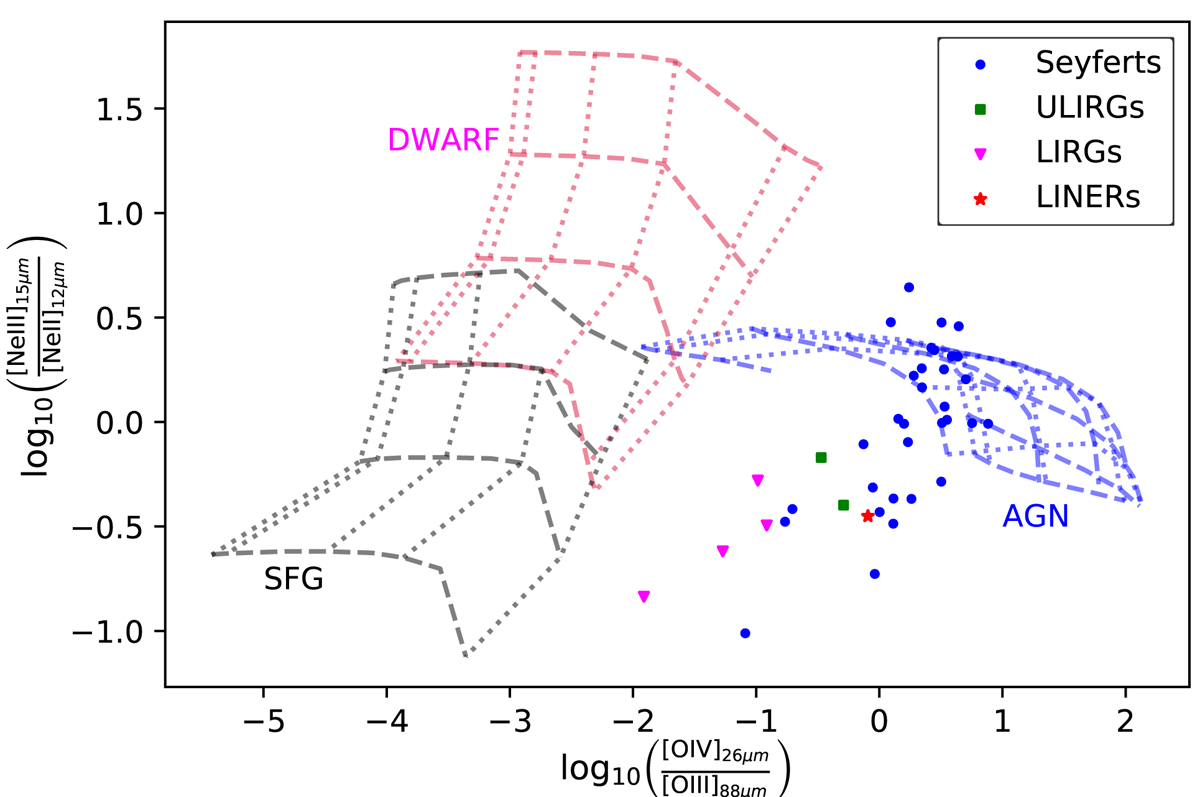
Fig. 1.
Download original image
BPT or diagnostic diagram in the IR range, proposed to distinguish between spectral types (Fernández-Ontiveros et al. 2016). Models computed with CLOUDY v17.02 (Ferland et al. 2017) are presented as lines: black for SFG models computed from the library STARBUST99 (González Delgado & Leitherer 1999) with 12+log(O/H) = 8.69 and log(N/O) = −0.86; magenta for dwarf models computed from a starburst of ∼106 yr with 12+log(O/H) = 8.0 and log(N/O) = −0.86; and blue for AGN models computed from the same SED used in this work (αOX = −0.8 and αUV = −1.0, see Sect. 3) with 12+log(O/H) = 8.69 and log(N/O) = −1.0. For all models, dotted lines trace models with the same electronic density (ranging 10–107 cm−3), while dashed lines represent fixed values of the ionization parameter U.
Current usage metrics show cumulative count of Article Views (full-text article views including HTML views, PDF and ePub downloads, according to the available data) and Abstracts Views on Vision4Press platform.
Data correspond to usage on the plateform after 2015. The current usage metrics is available 48-96 hours after online publication and is updated daily on week days.
Initial download of the metrics may take a while.