Open Access
Fig. 7
Download original image
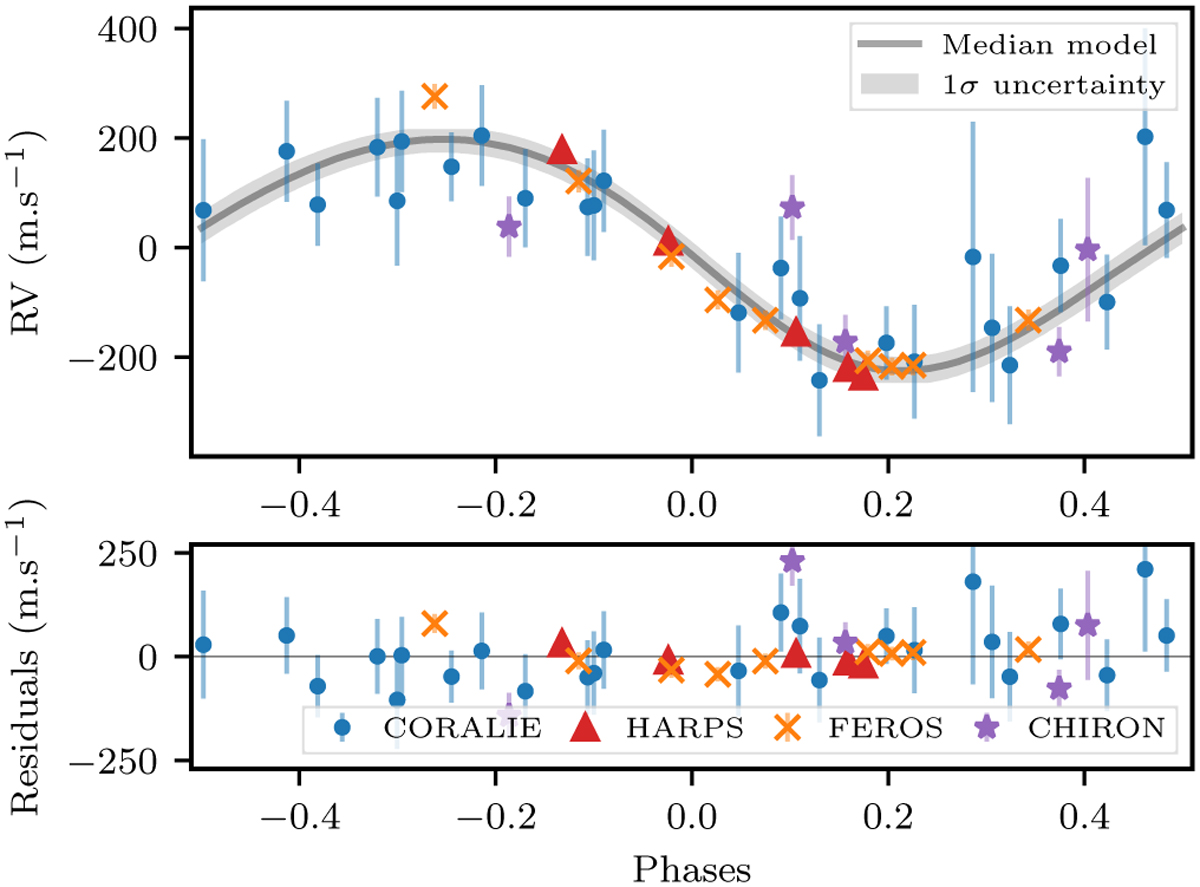
Radial velocities from CORALIE (blue dots), HARPS (red triangles), FEROS (orange crosses), and CHIRON (purple stars) for TOI-5153. Median Keplerian model is plotted as a gray line along with its corresponding 1σ uncertainty (gray shaded area).
Current usage metrics show cumulative count of Article Views (full-text article views including HTML views, PDF and ePub downloads, according to the available data) and Abstracts Views on Vision4Press platform.
Data correspond to usage on the plateform after 2015. The current usage metrics is available 48-96 hours after online publication and is updated daily on week days.
Initial download of the metrics may take a while.