Fig. 1
Download original image
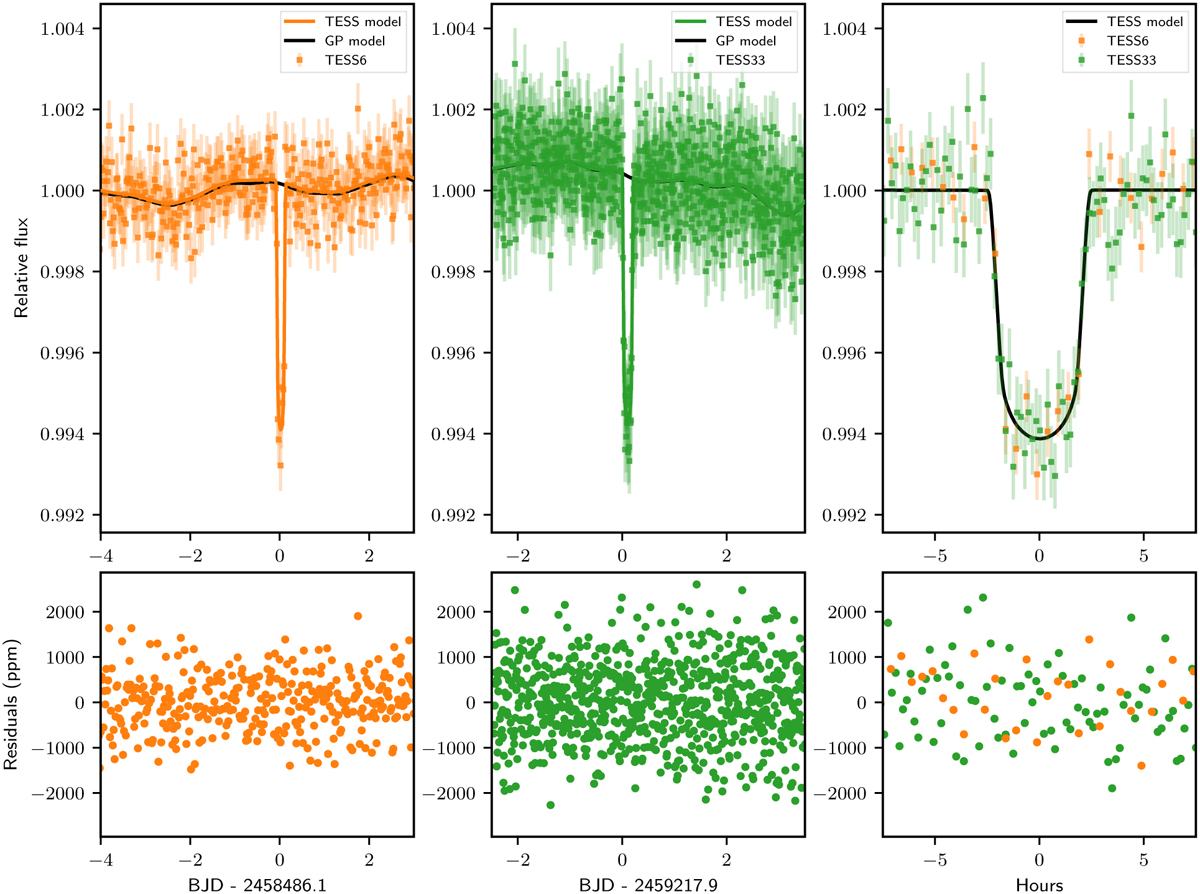
Top: photometric observations of TOI-5153 from TESS sector 6 at 30 min cadence (orange dots, left panel) and sector 33 at 10 min cadence (green dots, middle panel) with full median models (orange and green lines), and Gaussian process models (black line). The right panel shows the detrended and phase-folded data from both sectors (orange and green dots) with the phase-folded transit model in black. Bottom: each panel shows the residuals in parts per million between the full model and the respective light curve.
Current usage metrics show cumulative count of Article Views (full-text article views including HTML views, PDF and ePub downloads, according to the available data) and Abstracts Views on Vision4Press platform.
Data correspond to usage on the plateform after 2015. The current usage metrics is available 48-96 hours after online publication and is updated daily on week days.
Initial download of the metrics may take a while.