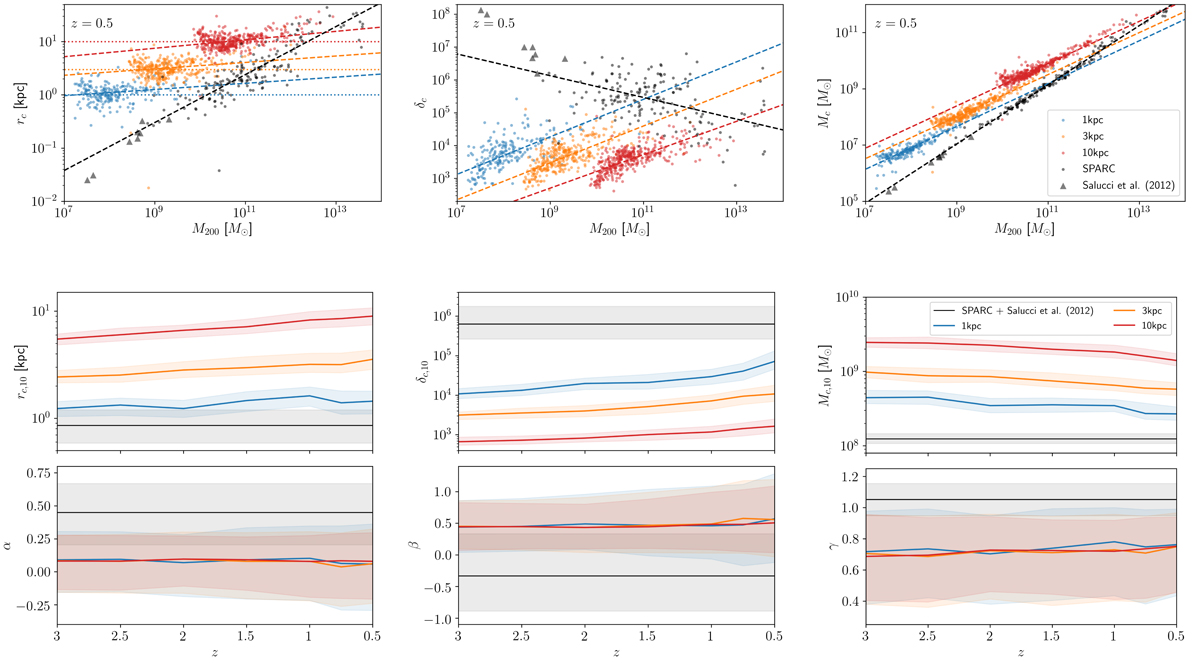
Fig. 6.

Download original image
Core radii rc (left), core densities δc (middle), and core masses Mc (right) versus M200 for halos in cosmological simulations of SIBEC-DM with Rc = 1 kpc, 3 kpc, and 10 kpc, using the Burkert profile. The upper plots show the scatter of halos at z = 0.5, with the fitted scaling Eqs. (44)–(46) shown in dashed lines, compared to the SPARC dataset (Li et al. 2020) and Milky Way dSphs (Salucci et al. 2012). The lower plots show the fitted median (solid) and the first and third quartiles (shaded) at several redshifts using Theil-Sen regression. The results from SPARC and the dSphs are also shown. In the scatter plot for rc the core radii Rc are indicated in dotted colored lines.
Current usage metrics show cumulative count of Article Views (full-text article views including HTML views, PDF and ePub downloads, according to the available data) and Abstracts Views on Vision4Press platform.
Data correspond to usage on the plateform after 2015. The current usage metrics is available 48-96 hours after online publication and is updated daily on week days.
Initial download of the metrics may take a while.


