Fig. 4
Download original image
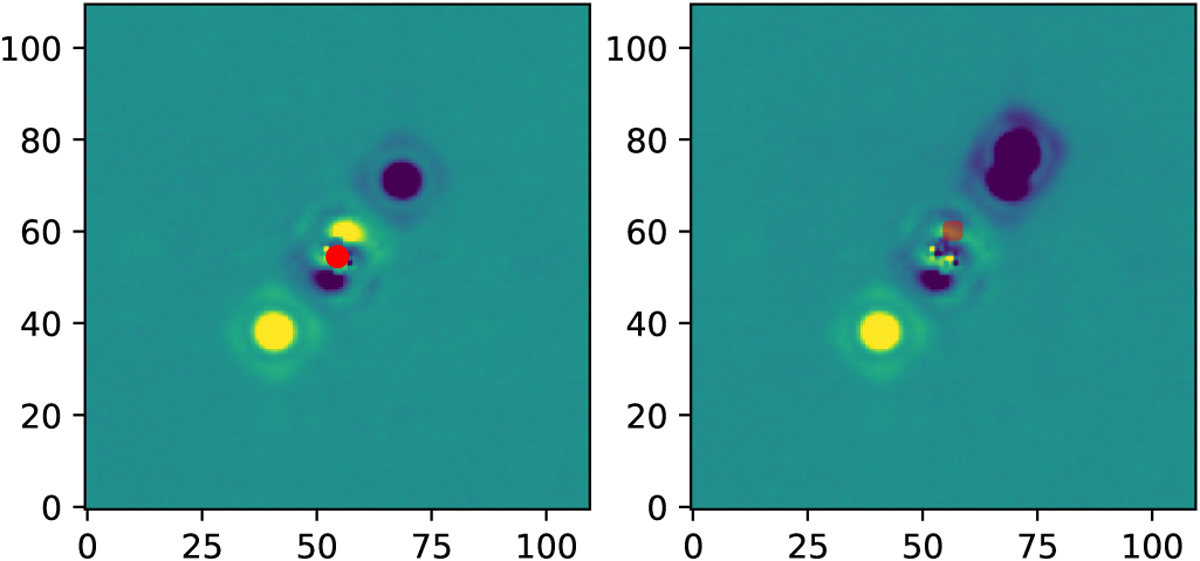
Determining astrometry of V773 Tau A, B, and C. The left hand panel shows the rotation-subtracted image of the V773 system, which was constructed by rotating the image by 180 degrees around the centroid of A (indicated by the red dot) and then subtracting it from the original image. The positive flux image of C is seen to the lower left and the negative flux image of C to the upper right. The positive flux image of the B component is then seen to the upper right of the centroid of A, indicating its location. The right hand panel shows the subtraction of the positive image of C from the location of B, with B marked with a red circle. Residuals from the subtraction processes can be seen around the location of A and B.
Current usage metrics show cumulative count of Article Views (full-text article views including HTML views, PDF and ePub downloads, according to the available data) and Abstracts Views on Vision4Press platform.
Data correspond to usage on the plateform after 2015. The current usage metrics is available 48-96 hours after online publication and is updated daily on week days.
Initial download of the metrics may take a while.