Fig. 2
Download original image
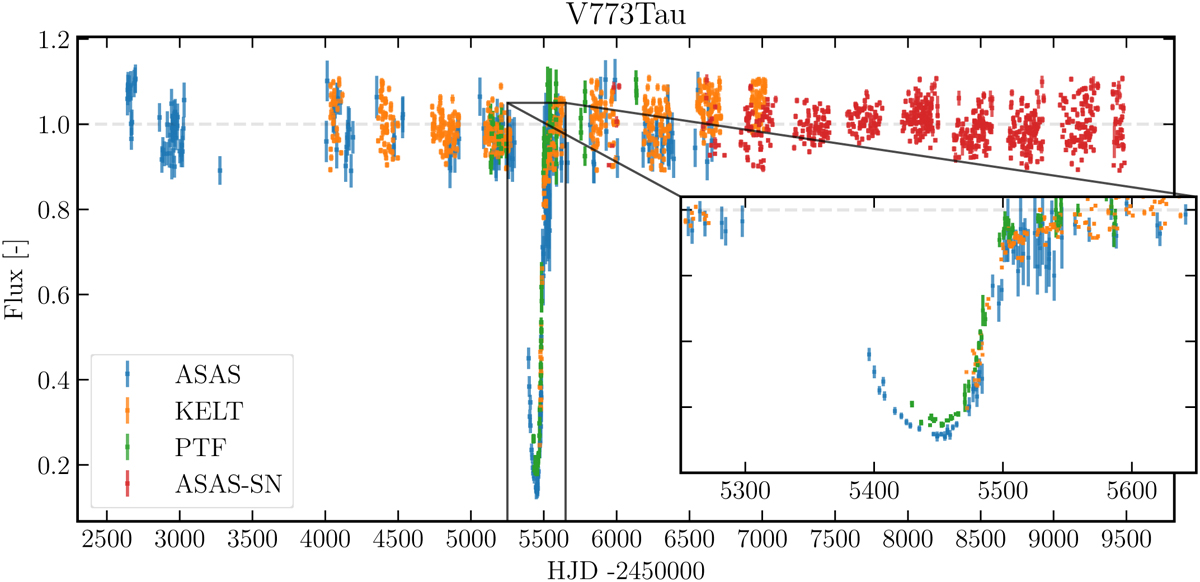
Optical photometry of V773 Tau system. The four different photometric surveys are represented by different colours, and each photometric series has been normalised using flux outside the main eclipse. The inset panel shows the eclipse light curve in greater detail. The PTF and KELT curves show different depths of the eclipse, indicating the presence of sub-micron dust that causes different amounts of optical extinction in the different pass bands of the two surveys.
Current usage metrics show cumulative count of Article Views (full-text article views including HTML views, PDF and ePub downloads, according to the available data) and Abstracts Views on Vision4Press platform.
Data correspond to usage on the plateform after 2015. The current usage metrics is available 48-96 hours after online publication and is updated daily on week days.
Initial download of the metrics may take a while.