Fig. 6
Download original image
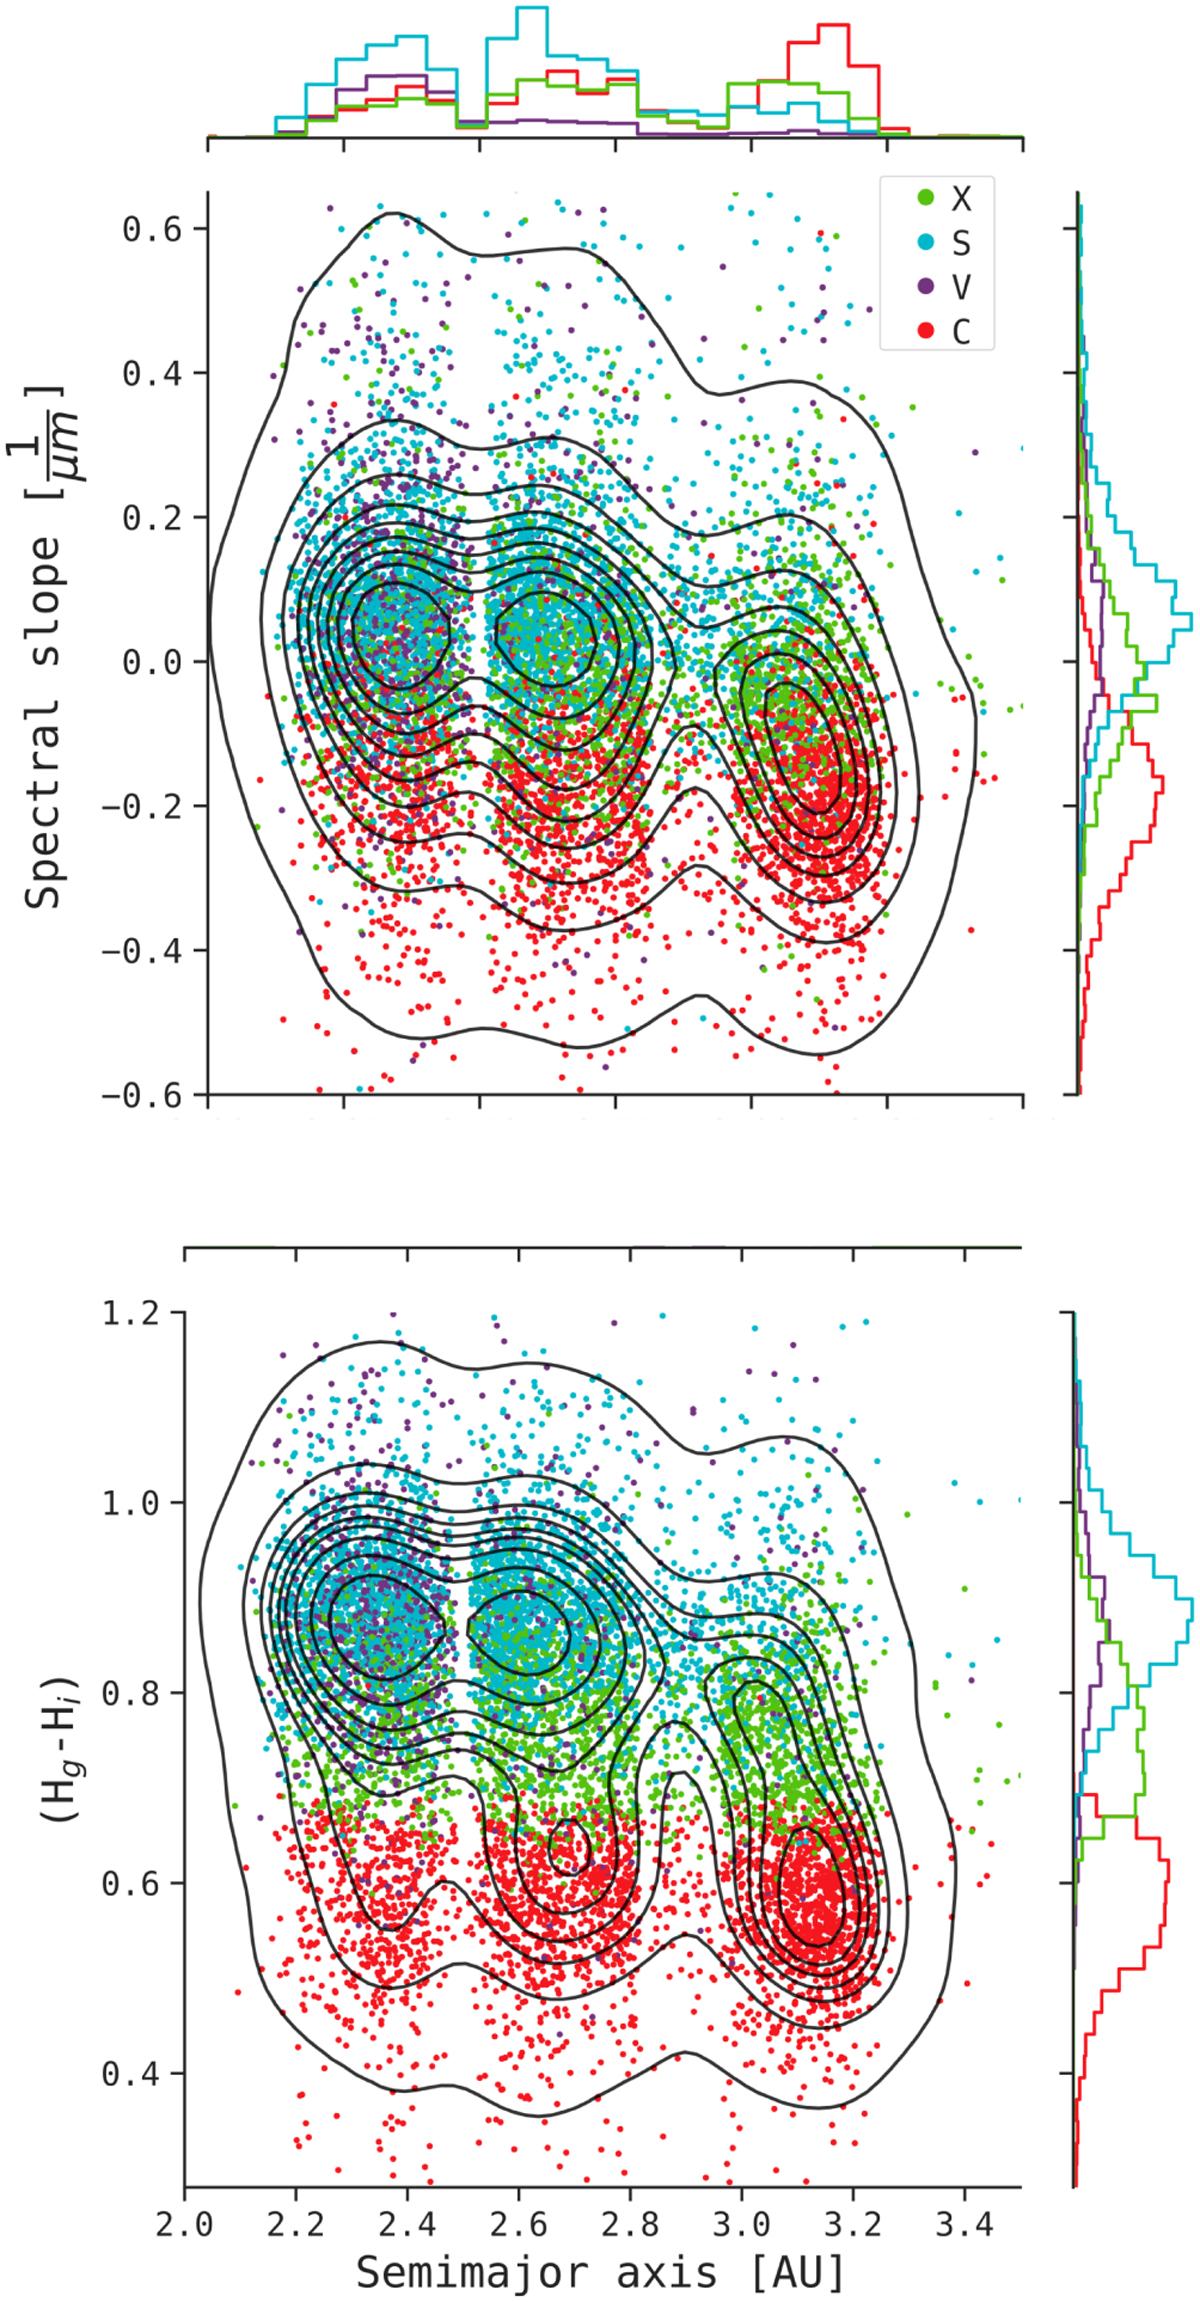
Semimajor axis distribution of asteroids with more than 60% probability of belonging to the assigned taxonomic class). Panel a: semimajor axis vs. spectral slope. Panel b: semimajor axis vs Hg − Hi. For both, on marginal axes we show histograms for each spectral class. We also plot the contours of the 2D density. Color scheme for spectral type are the same as before.
Current usage metrics show cumulative count of Article Views (full-text article views including HTML views, PDF and ePub downloads, according to the available data) and Abstracts Views on Vision4Press platform.
Data correspond to usage on the plateform after 2015. The current usage metrics is available 48-96 hours after online publication and is updated daily on week days.
Initial download of the metrics may take a while.