Fig. 8.
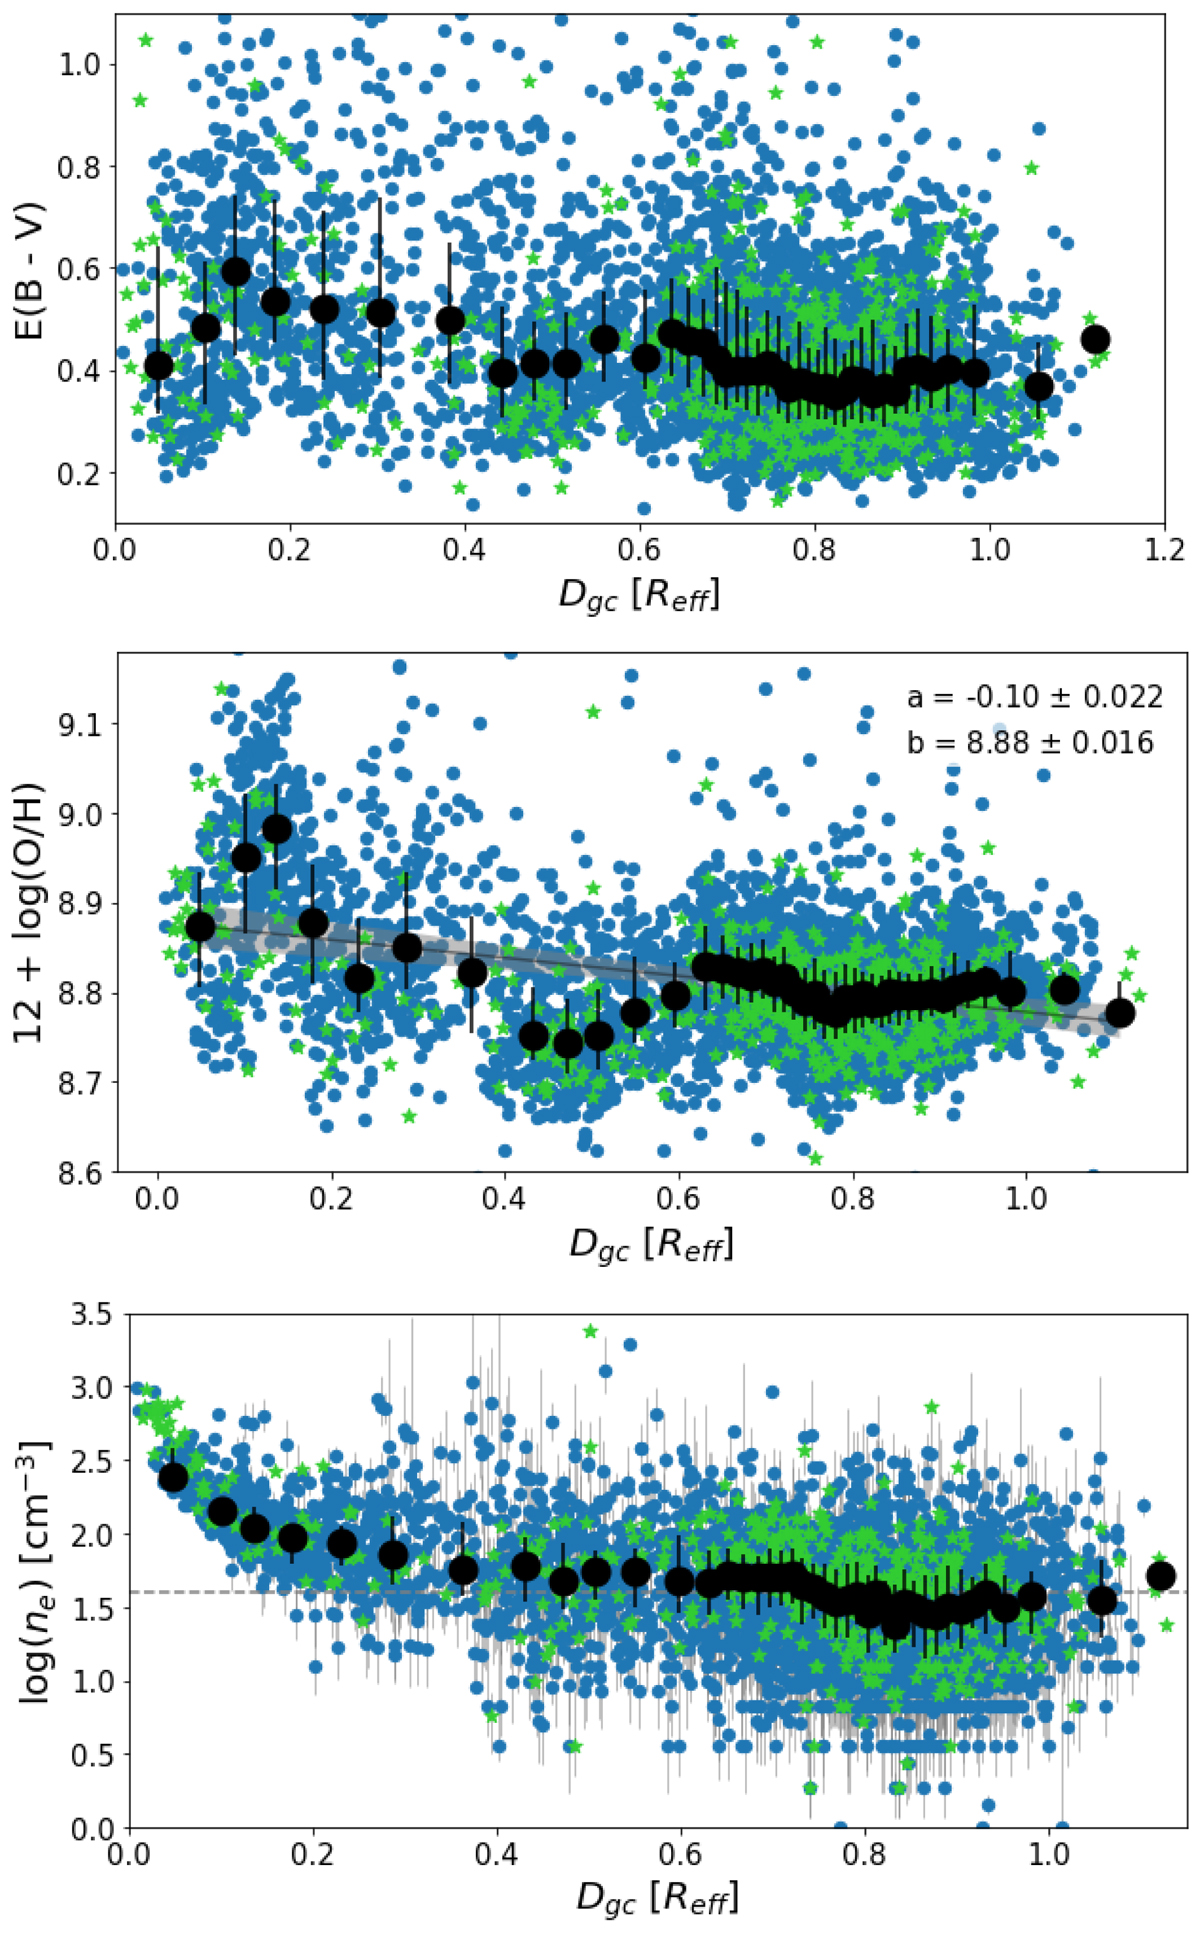
Download original image
Same as Fig. 7 but showing the extinction (top), oxygen abundance (centre) and density (bottom panel) of the H II regions. Central panel: a linear fit to the data (in black) with a 95% confidence interval (shaded grey area). We also indicate the best fit parameters in the upper right corner. Bottom panel: the grey dashed line in the bottom panel indicates the sensitivity limit of the density determination method: points below this lines are consistent – within measurement uncertainty – with ne ≃ 1 cm−3. Error bars span the first to third quartile of a distribution of ne obtained from 1000 Monte Carlo realisations of the [S II] ratio (see Sect. 5).
Current usage metrics show cumulative count of Article Views (full-text article views including HTML views, PDF and ePub downloads, according to the available data) and Abstracts Views on Vision4Press platform.
Data correspond to usage on the plateform after 2015. The current usage metrics is available 48-96 hours after online publication and is updated daily on week days.
Initial download of the metrics may take a while.