Fig. 7.
Download original image
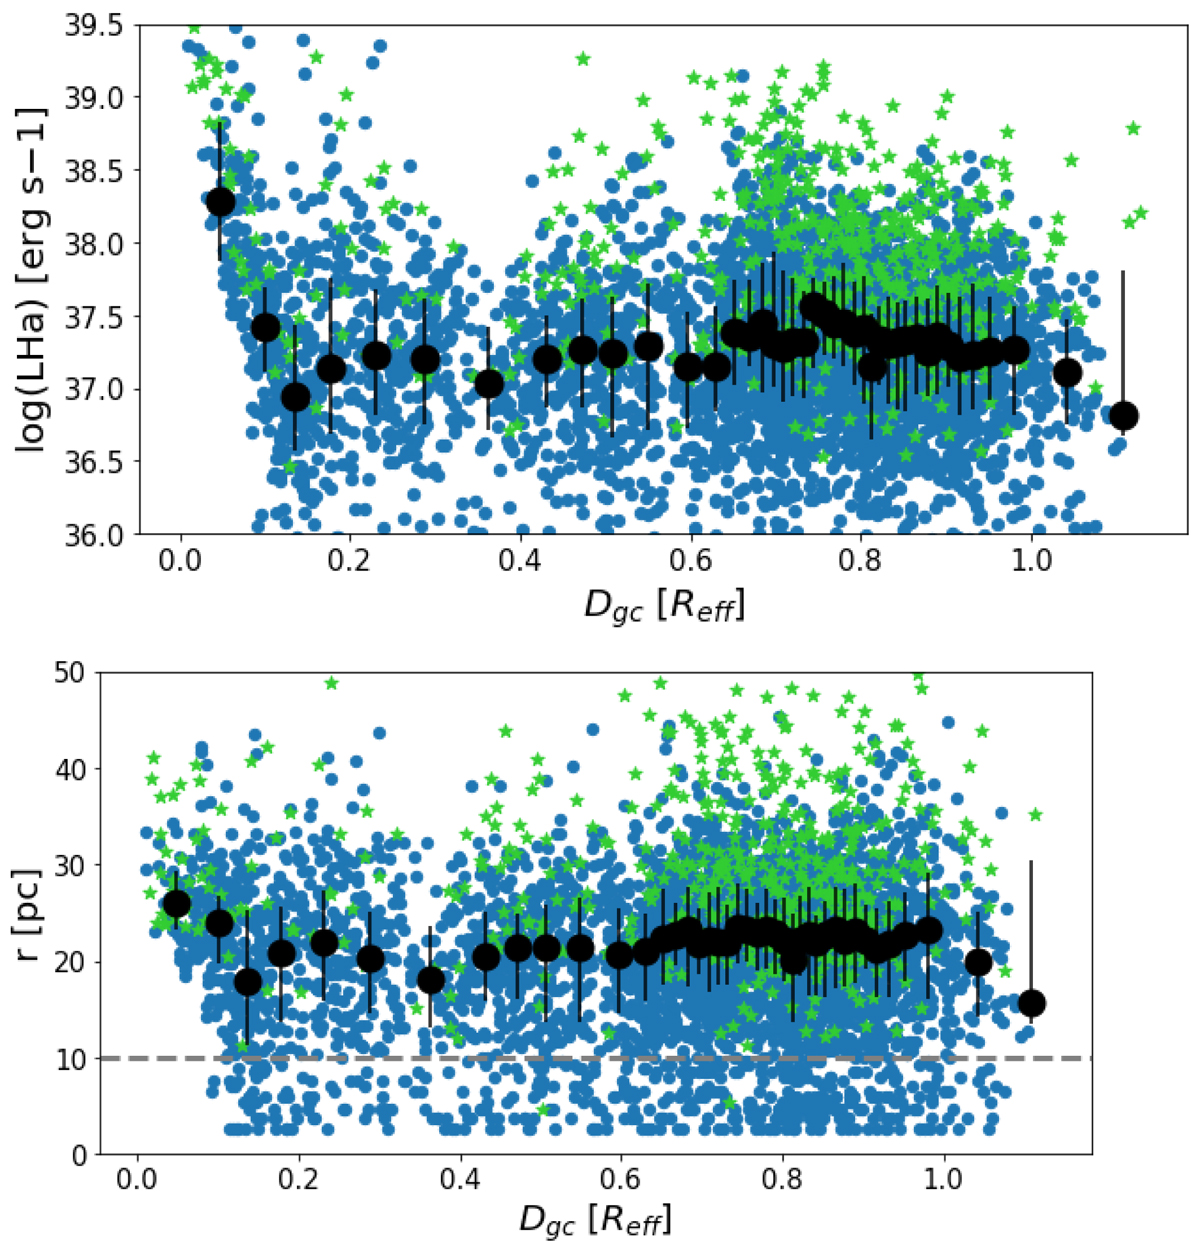
Luminosity (top panel) and size (bottom panel) of the final sample of H II regions as function of galactocentric radius. Green stars indicate regions hosting either a YSC younger than 10 Myr or a WR star. The large black dots indicate the median (±quartiles) in radial bins with equal number of objects (≃120). The dashed line in the bottom plot indicates the spatial resolution limit of the MUSE data.
Current usage metrics show cumulative count of Article Views (full-text article views including HTML views, PDF and ePub downloads, according to the available data) and Abstracts Views on Vision4Press platform.
Data correspond to usage on the plateform after 2015. The current usage metrics is available 48-96 hours after online publication and is updated daily on week days.
Initial download of the metrics may take a while.