Fig. 6.
Download original image
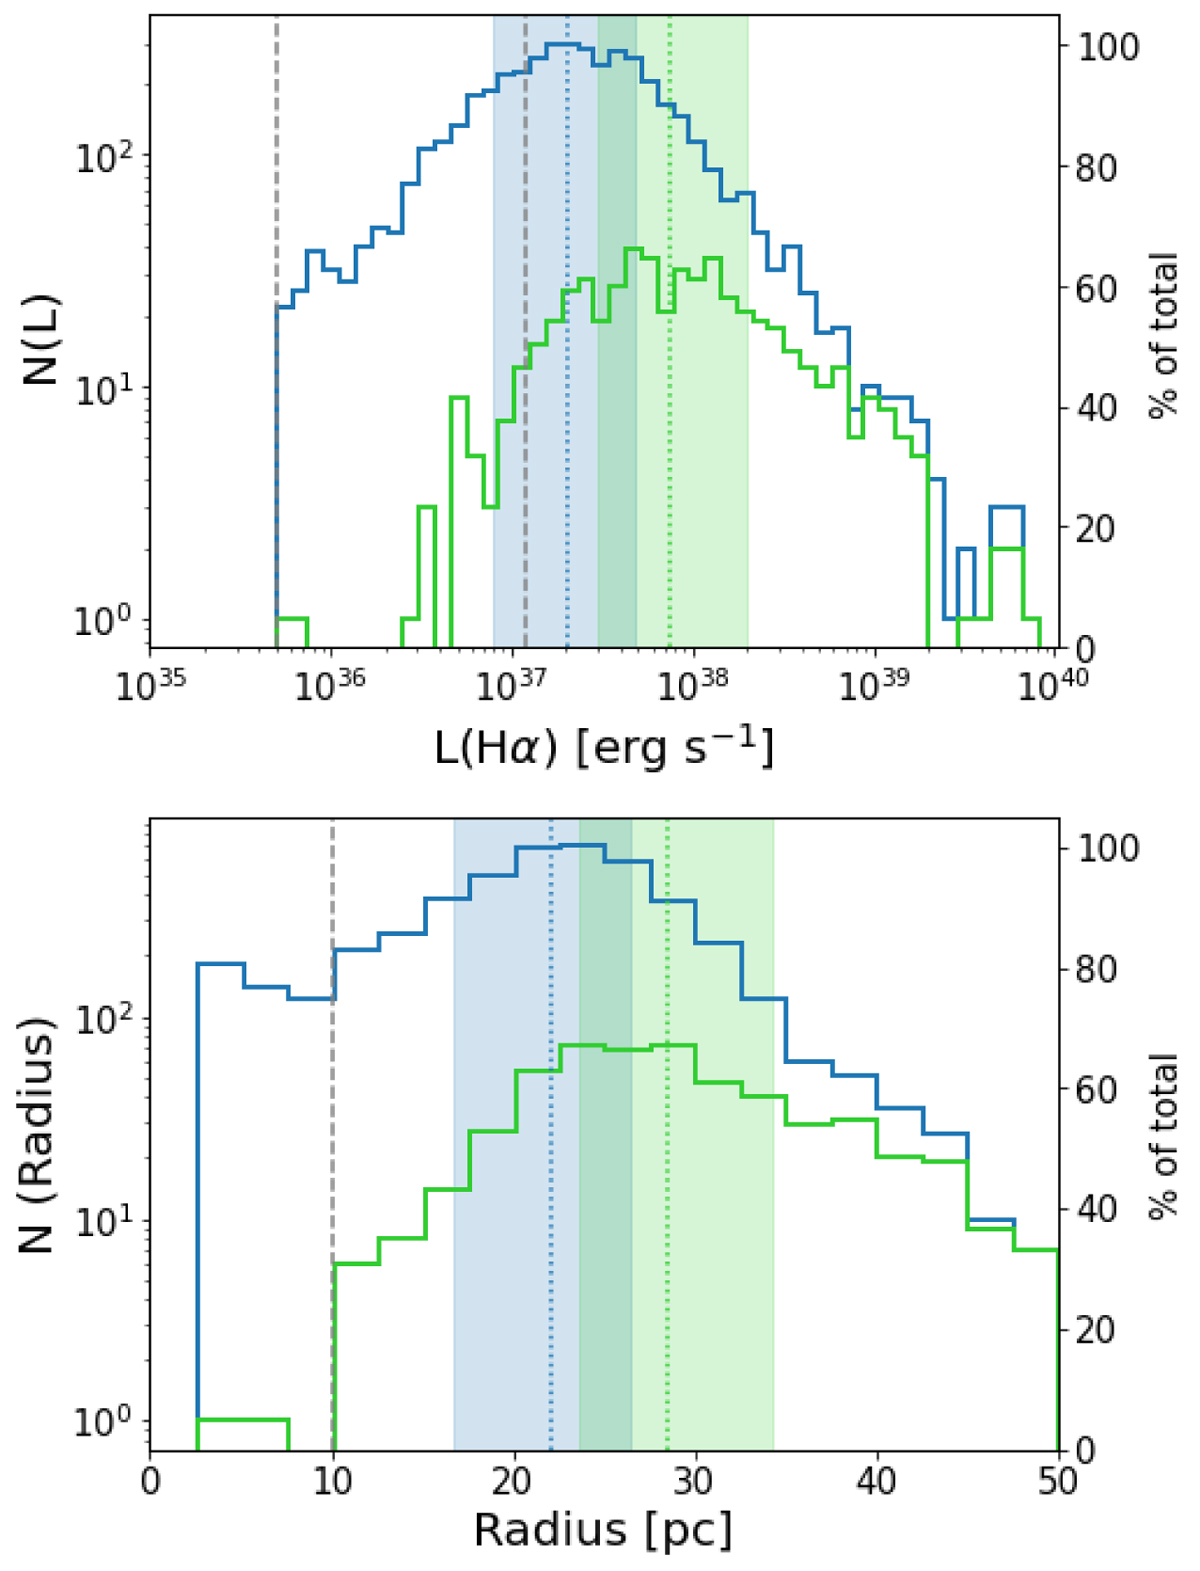
Luminosity function (top) and size distribution (bottom) of the final sample of H II regions. In blue we show the total distribution, and in green the distribution for regions hosting either a YSC younger than 10 Myr or a WR star. The vertical lines and shaded areas indicate the median and quartiles of each distribution. The grey dashed lines in the top panel indicate the minimum luminosity of a region of radius 10 and 50 pc based on the SB threshold used for the H II region selection. Bottom panel: the grey dashed line corresponds to the spatial resolution limit of the MUSE data (regions below this line are unresolved in our dataset).
Current usage metrics show cumulative count of Article Views (full-text article views including HTML views, PDF and ePub downloads, according to the available data) and Abstracts Views on Vision4Press platform.
Data correspond to usage on the plateform after 2015. The current usage metrics is available 48-96 hours after online publication and is updated daily on week days.
Initial download of the metrics may take a while.