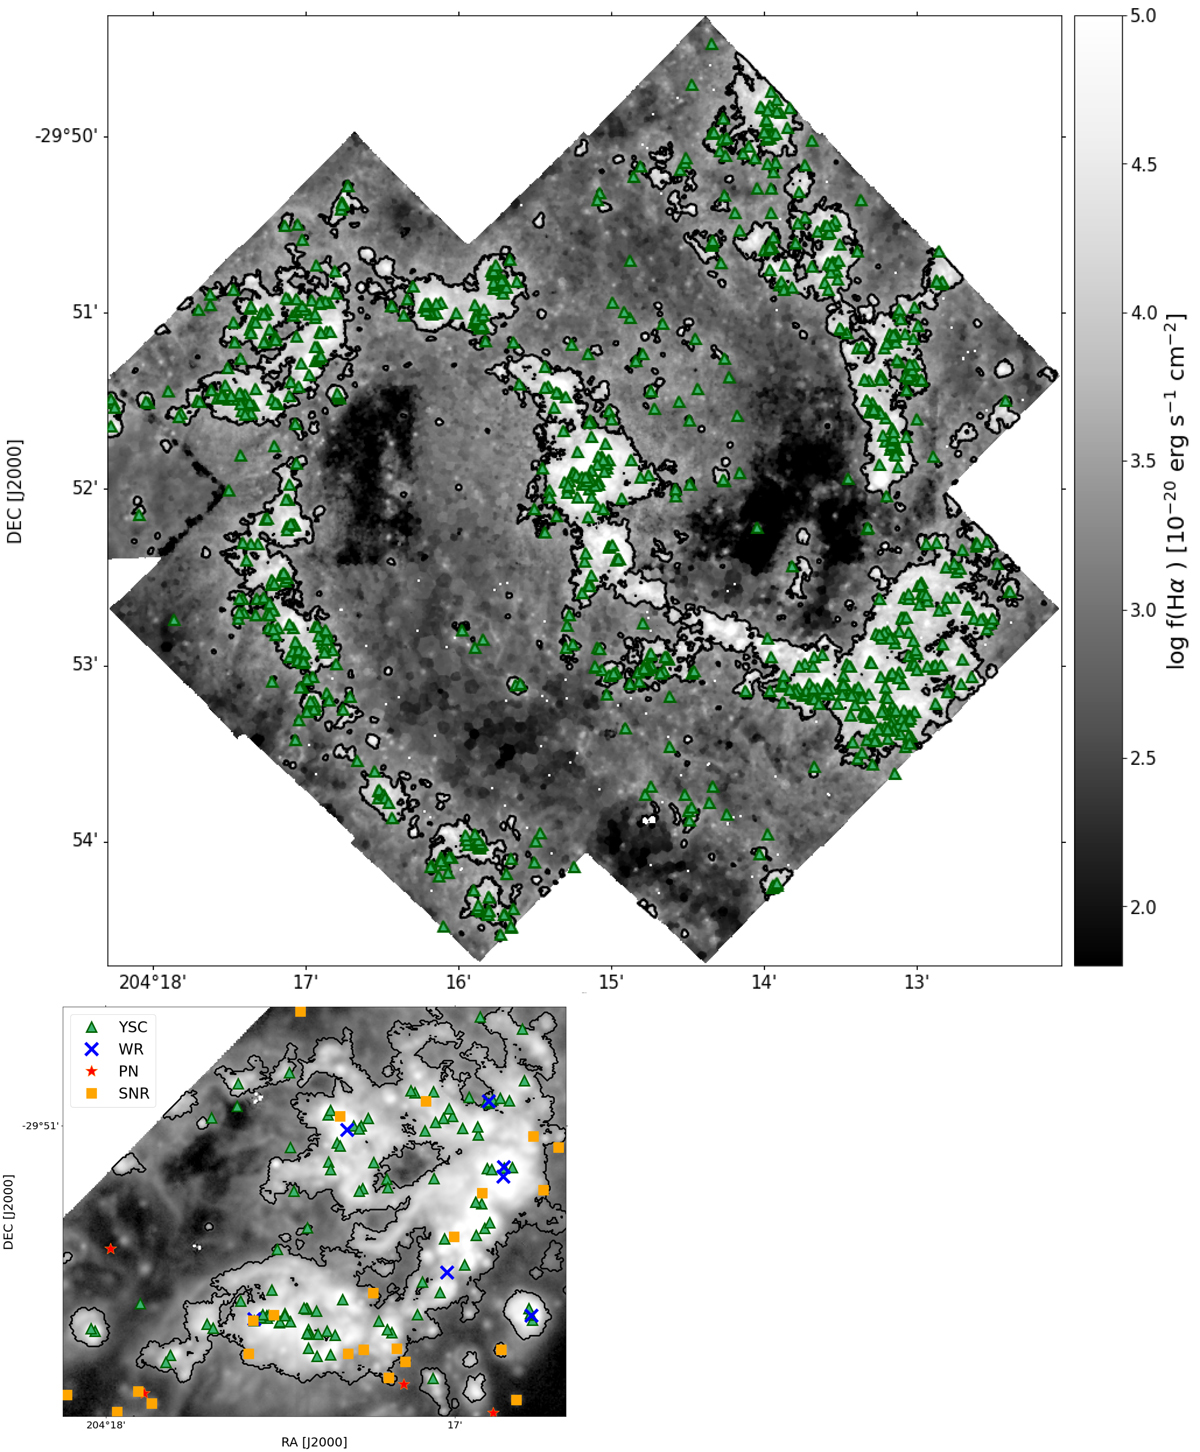
Fig. 5.
Download original image
Stellar population in the MUSE FoV. Top panel: extinction-corrected Hα map with the location of YSCs of age ≤10 Myr (green triangles). Bottom panel: enlargement of one of the H II region complexes. Green triangles indicate the position of YSCs observed with HST (Adamo et al. 2015), blue crosses and red stars indicate respectively WR stars and PNe identified in the MUSE dataset and orange squares are SNR from Long et al. (2022).
Current usage metrics show cumulative count of Article Views (full-text article views including HTML views, PDF and ePub downloads, according to the available data) and Abstracts Views on Vision4Press platform.
Data correspond to usage on the plateform after 2015. The current usage metrics is available 48-96 hours after online publication and is updated daily on week days.
Initial download of the metrics may take a while.