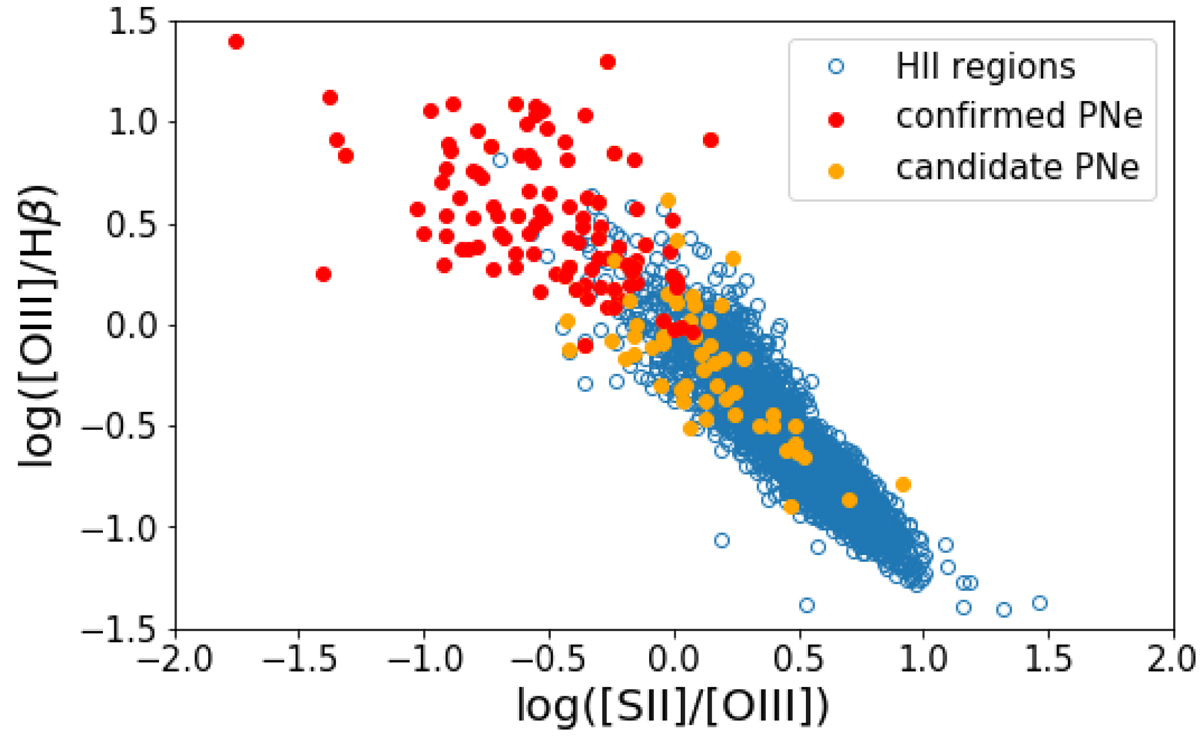
Fig. 2.
Download original image
Location of spectroscopically confirmed PNe (filled red points), PNe candidates (filled orange points) and H II regions (open blue circles) in a diagram of [O III] λλ4959,5007/Hβ versus [S II] λλ6716,6731/[O III] λλ4959,5007. We applied a first order background correction to the PN fluxes as described in Sect. 3.3. We observe that the confirmed PNe occupy a well-defined region in the diagram.
Current usage metrics show cumulative count of Article Views (full-text article views including HTML views, PDF and ePub downloads, according to the available data) and Abstracts Views on Vision4Press platform.
Data correspond to usage on the plateform after 2015. The current usage metrics is available 48-96 hours after online publication and is updated daily on week days.
Initial download of the metrics may take a while.