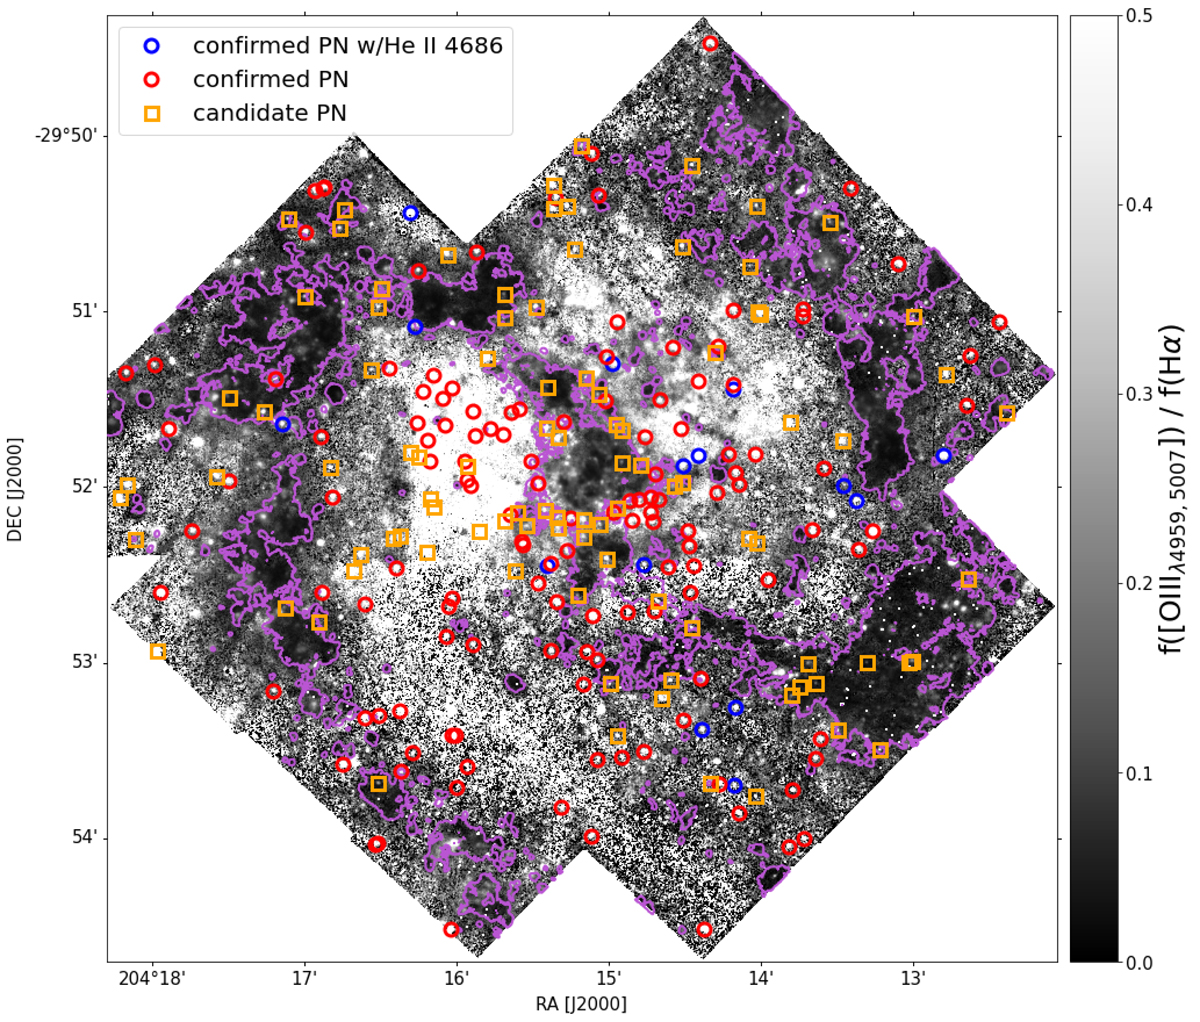
Fig. B.1.
Download original image
Location of the identified PNe on a map of [O III]/Hα. The coordinates of all objects are given in Table B.1. Blue and red circles indicate spectroscopically confirmed candidates (Class 1 and 2 in Table B.1) with and without He IIλ4686 detection, respectively. The orange squares indicate candidates visually identified in the HST+MUSE dataset (Class 3 in Table B.1). In purple we indicate the outer boundaries of the H II regions.
Current usage metrics show cumulative count of Article Views (full-text article views including HTML views, PDF and ePub downloads, according to the available data) and Abstracts Views on Vision4Press platform.
Data correspond to usage on the plateform after 2015. The current usage metrics is available 48-96 hours after online publication and is updated daily on week days.
Initial download of the metrics may take a while.