Open Access
Fig. A.2.
Download original image
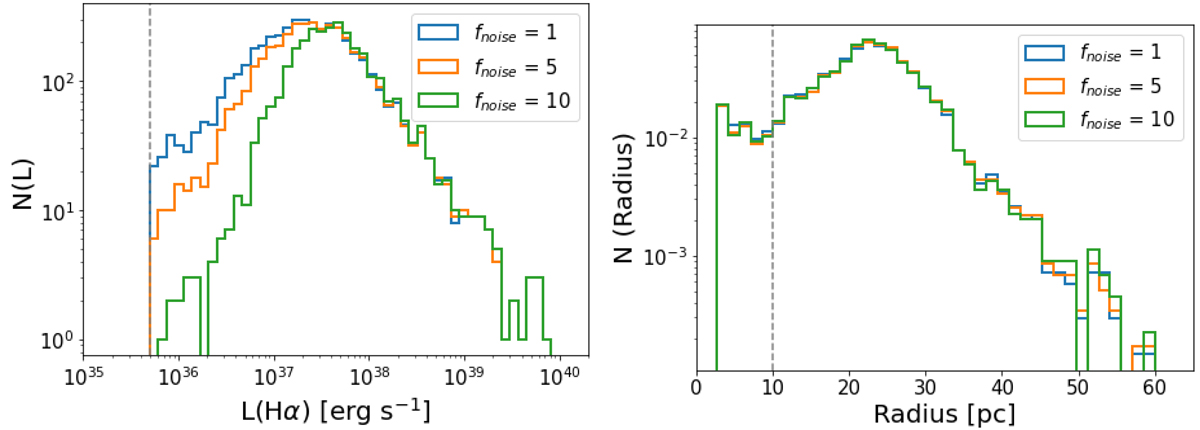
Luminosity function (left panel) and size distribution (right panel) for the samples of H II regions obtained with three different values of the fnoise parameter (Eq. 1). The grey dashed lines indicate, respectively, the adopted adopted H II SB threshold and the spatial resolution limit of the MUSE data.
Current usage metrics show cumulative count of Article Views (full-text article views including HTML views, PDF and ePub downloads, according to the available data) and Abstracts Views on Vision4Press platform.
Data correspond to usage on the plateform after 2015. The current usage metrics is available 48-96 hours after online publication and is updated daily on week days.
Initial download of the metrics may take a while.