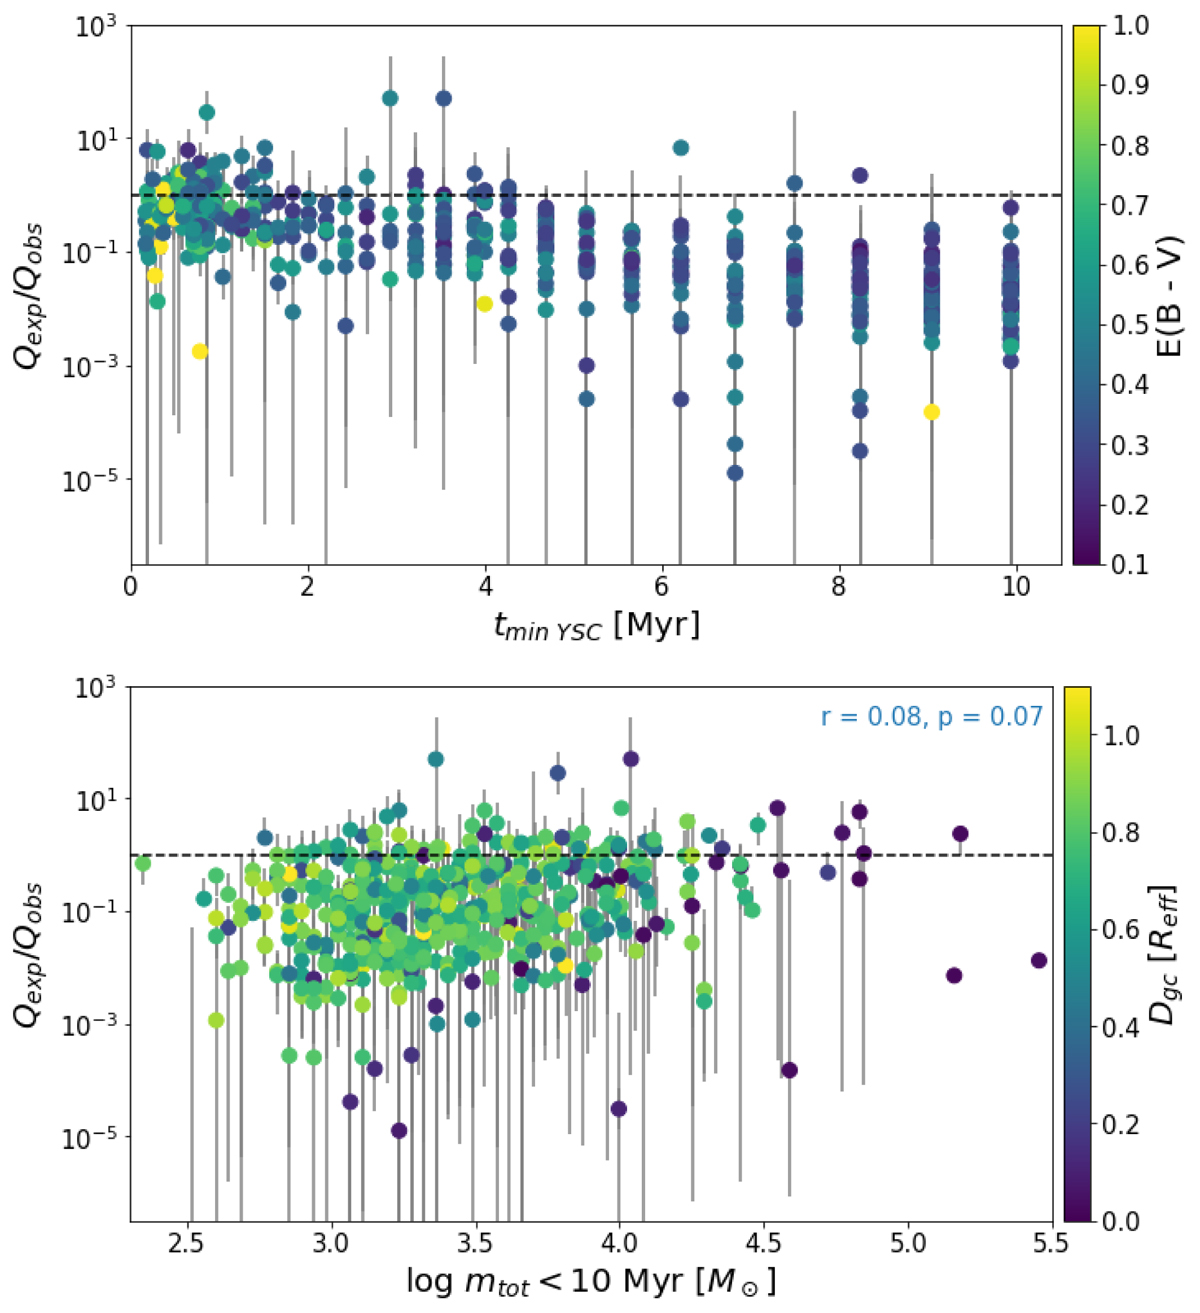
Fig. 14.
Download original image
Ratio of expected to observed Q(H0) for all the H II regions hosting YSCs or WR stars. The black dashed line indicates a ratio of 1 (fesc = 0). Top panel: Q ratio as function of the age of the youngest cluster (tmin) hosted in each region, colour coded by the region’s average extinction. Bottom panel: Q ratio as function of the total mass in clusters younger than 10 Myr, colour coded by galactocentric distance.
Current usage metrics show cumulative count of Article Views (full-text article views including HTML views, PDF and ePub downloads, according to the available data) and Abstracts Views on Vision4Press platform.
Data correspond to usage on the plateform after 2015. The current usage metrics is available 48-96 hours after online publication and is updated daily on week days.
Initial download of the metrics may take a while.