Fig. 13.
Download original image
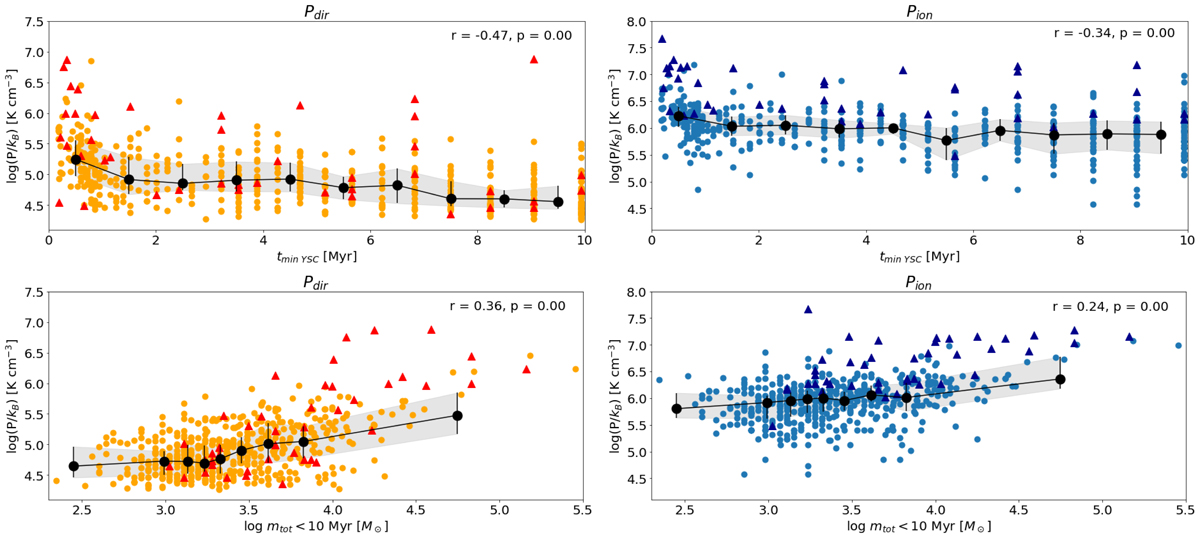
Pressure terms as function of the age of the youngest cluster in the region (top) and the total mass of clusters younger than 10 Myr (bottom). Red and blue triangles indicate evolved regions hosting a SNR. The black dots and line indicate the median (±quartiles, shaded in grey) in radial bins of 1 Myr (top) and in mass bins with equal number of objects (bottom, ≃40 objects/bin). On the top right, we indicate the value of the Pearson’s correlation coefficient r.
Current usage metrics show cumulative count of Article Views (full-text article views including HTML views, PDF and ePub downloads, according to the available data) and Abstracts Views on Vision4Press platform.
Data correspond to usage on the plateform after 2015. The current usage metrics is available 48-96 hours after online publication and is updated daily on week days.
Initial download of the metrics may take a while.