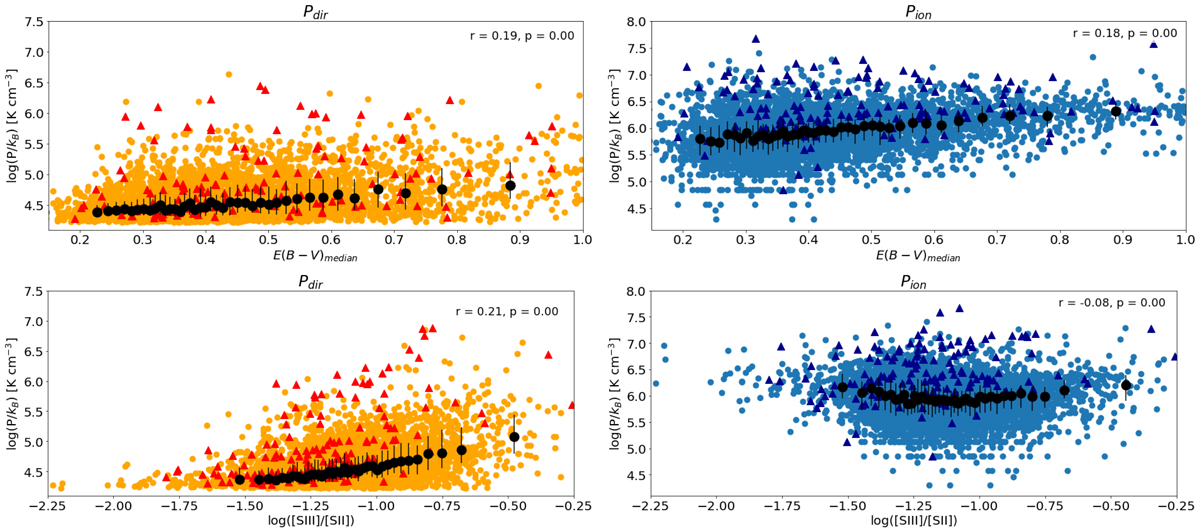
Fig. 12.
Download original image
Pressure terms as function of average reddening (top panels) and radiation field hardness (bottom panels) in the regions. Red and blue triangles indicate evolved H II regions (hosting a SNR). The black dots indicate the median (±quartiles) pressure in radial bins containing an equal number of points. On the top right, we indicate the value of the Pearson’s correlation coefficient r.
Current usage metrics show cumulative count of Article Views (full-text article views including HTML views, PDF and ePub downloads, according to the available data) and Abstracts Views on Vision4Press platform.
Data correspond to usage on the plateform after 2015. The current usage metrics is available 48-96 hours after online publication and is updated daily on week days.
Initial download of the metrics may take a while.