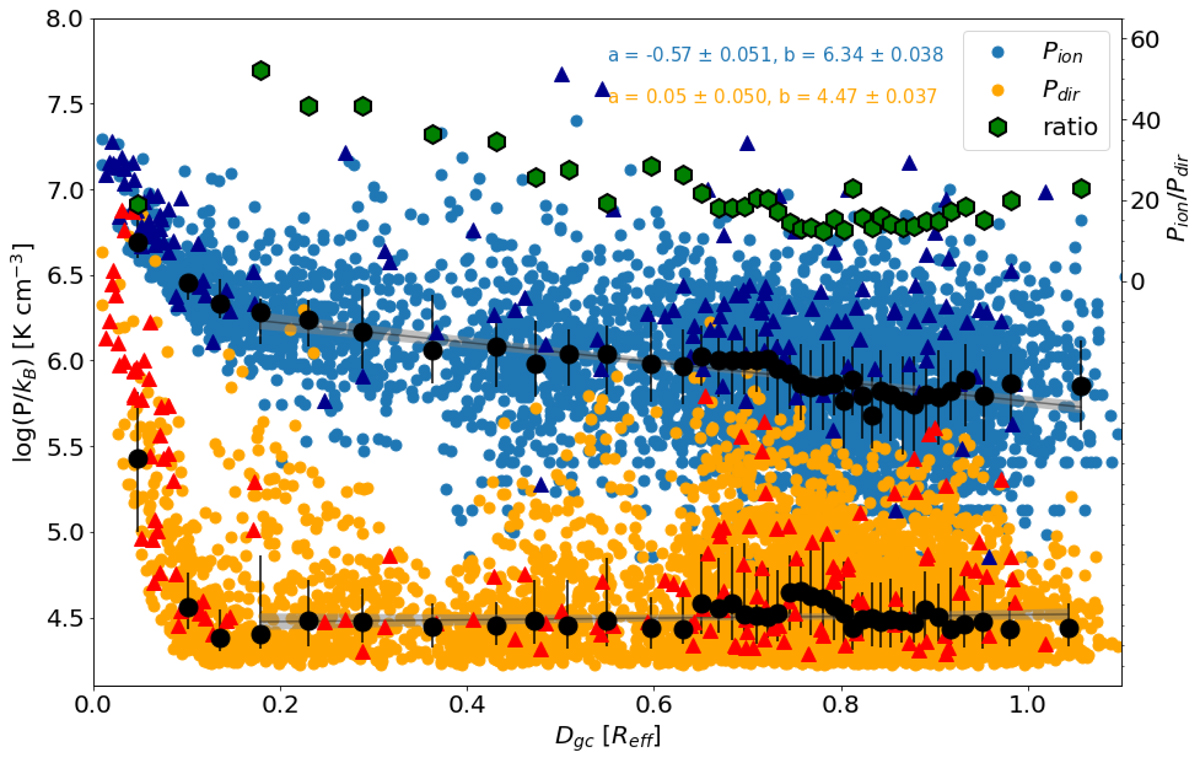
Fig. 11.
Download original image
Ionised gas pressure (in blue), direct radiation pressure (in orange) and their ratio (in green, values indicated on the right axis) as function of galactocentric radius. Red and dark blue triangles indicate evolved H II regions (hosting a SNR). The black dots indicate the median (±first and third quartile) pressure in radial bins containing an equal number of points (∼120). On top of the figure, we indicate the coefficients of a linear fit to the data.
Current usage metrics show cumulative count of Article Views (full-text article views including HTML views, PDF and ePub downloads, according to the available data) and Abstracts Views on Vision4Press platform.
Data correspond to usage on the plateform after 2015. The current usage metrics is available 48-96 hours after online publication and is updated daily on week days.
Initial download of the metrics may take a while.