Fig. 6
Download original image
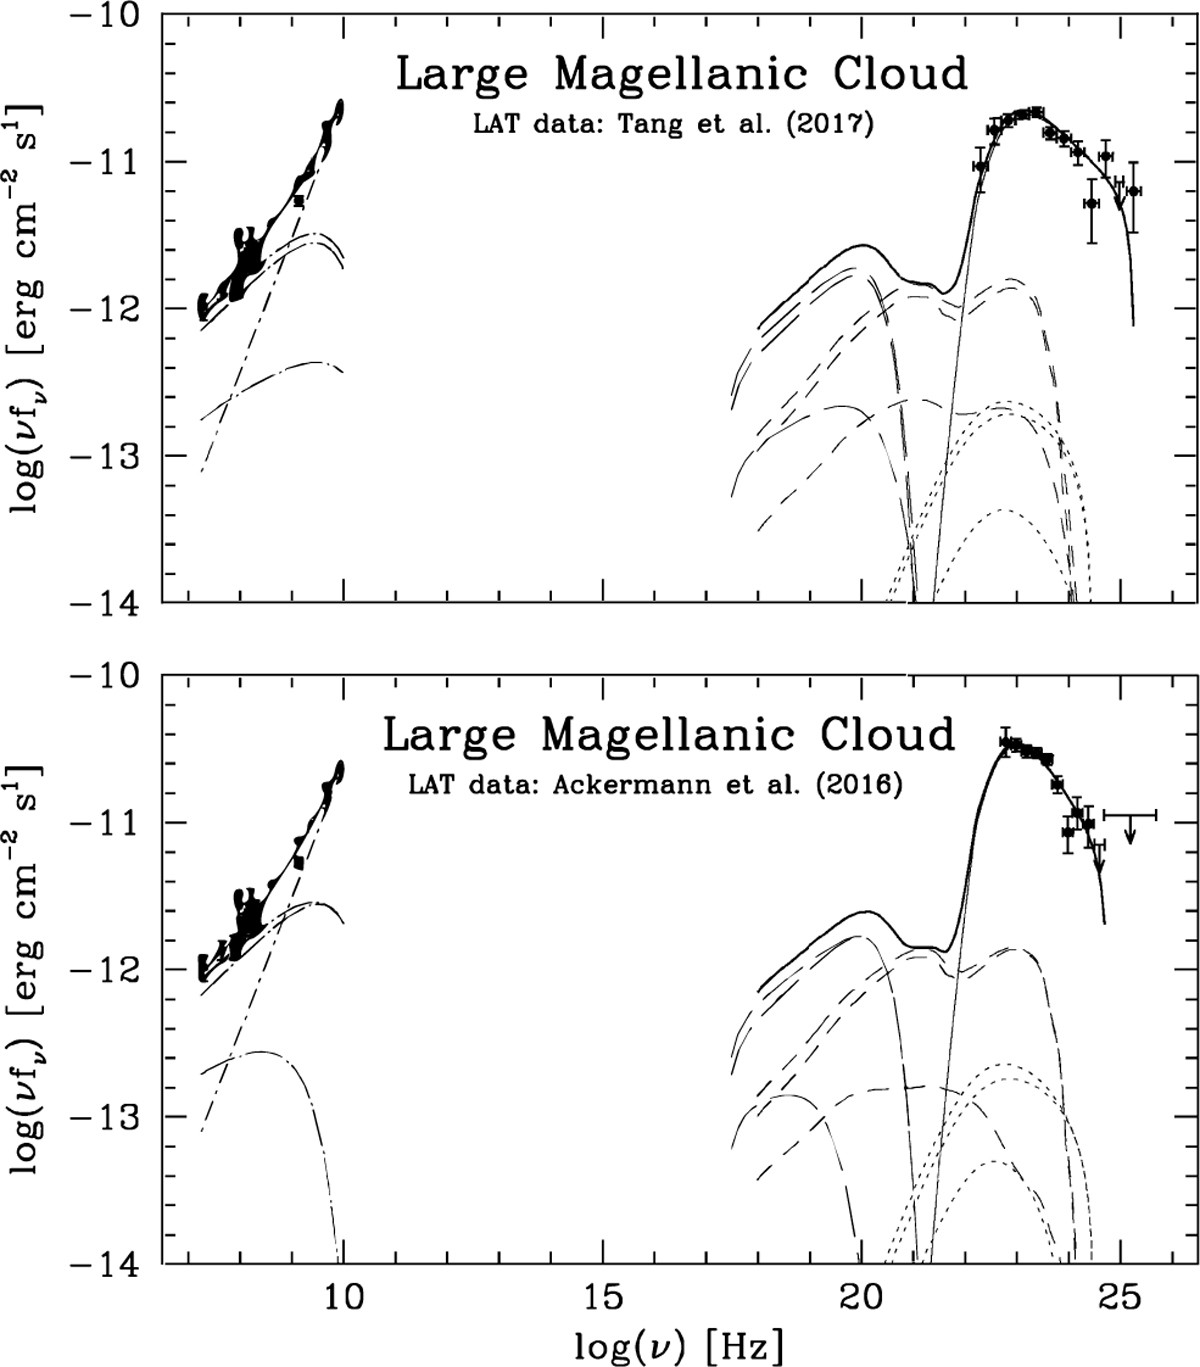
Broadband (radio-γ, 19.7 MHz – 100 GeV) SED of the LMC disk. Data points (Table 2) are shown as dots: γ-ray data are from T+17 (top; reference set) and A+16 (bottom; auxiliary set). Model predictions are shown as curves. Emission components are plotted by the following line types: synchrotron, dot-long-dashed; thermal ff, dot-short-dashed; total radio, solid; Comptonized CMB, long-dashed; Comptonized starlight (EBL+FGL), short-dashed; NT bremsstrahlung, dotted; pionic, solid. For each type of NT leptonic yield secondary, primary, and total emissions are denoted as curves of progressively higher flux. In the X-ray and γ-ray range, on top of the emissions resulting from the various radiative processes a solid line indicates the cumulative emission.
Current usage metrics show cumulative count of Article Views (full-text article views including HTML views, PDF and ePub downloads, according to the available data) and Abstracts Views on Vision4Press platform.
Data correspond to usage on the plateform after 2015. The current usage metrics is available 48-96 hours after online publication and is updated daily on week days.
Initial download of the metrics may take a while.