Fig. 5
Download original image
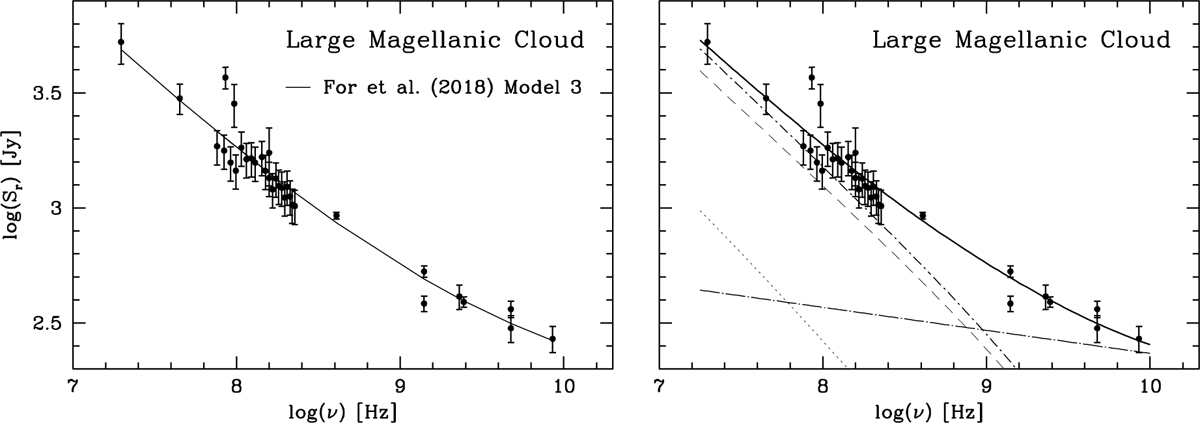
Large Magellanic Cloud radio spectrum. The data points (dots) are from Table 2 of For et al. (2018). Left: model 3 of For et al. (2018, 2PL), shown as a solid curve. Right: the two-component model (solid curve) includes synchrotron radiation (dot-short-dashed curve) and thermal ff emission (dot-long-dashed curve); the dashed and dotted curves denote the primary and secondary synchrotron contributions, respectively (the latter corresponds to the T+17 γ-ray dataset).
Current usage metrics show cumulative count of Article Views (full-text article views including HTML views, PDF and ePub downloads, according to the available data) and Abstracts Views on Vision4Press platform.
Data correspond to usage on the plateform after 2015. The current usage metrics is available 48-96 hours after online publication and is updated daily on week days.
Initial download of the metrics may take a while.