Fig. 2
Download original image
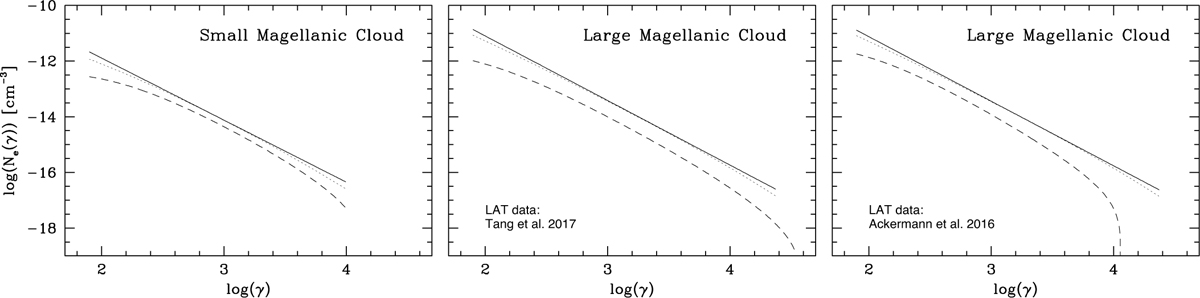
CRe spectra in the Magellanic Clouds. The curves are the secondary spectra (dashed), primary spectra (dotted), and the primaries’ local PL representations (solid). In each panel the normalization of the primary CRe spectrum to its PL counterpart is chosen such that they nearly overlap. The primary CRe injection indices, qi, are 2.28 (SMC) and 2.23 (LMC). The two LMC CRe spectra panels refer, respectively, to the T+17 and A+16 Fermi/LAT datasets, as secondary spectra are derived from the pionic fits to the γ-ray data.
Current usage metrics show cumulative count of Article Views (full-text article views including HTML views, PDF and ePub downloads, according to the available data) and Abstracts Views on Vision4Press platform.
Data correspond to usage on the plateform after 2015. The current usage metrics is available 48-96 hours after online publication and is updated daily on week days.
Initial download of the metrics may take a while.