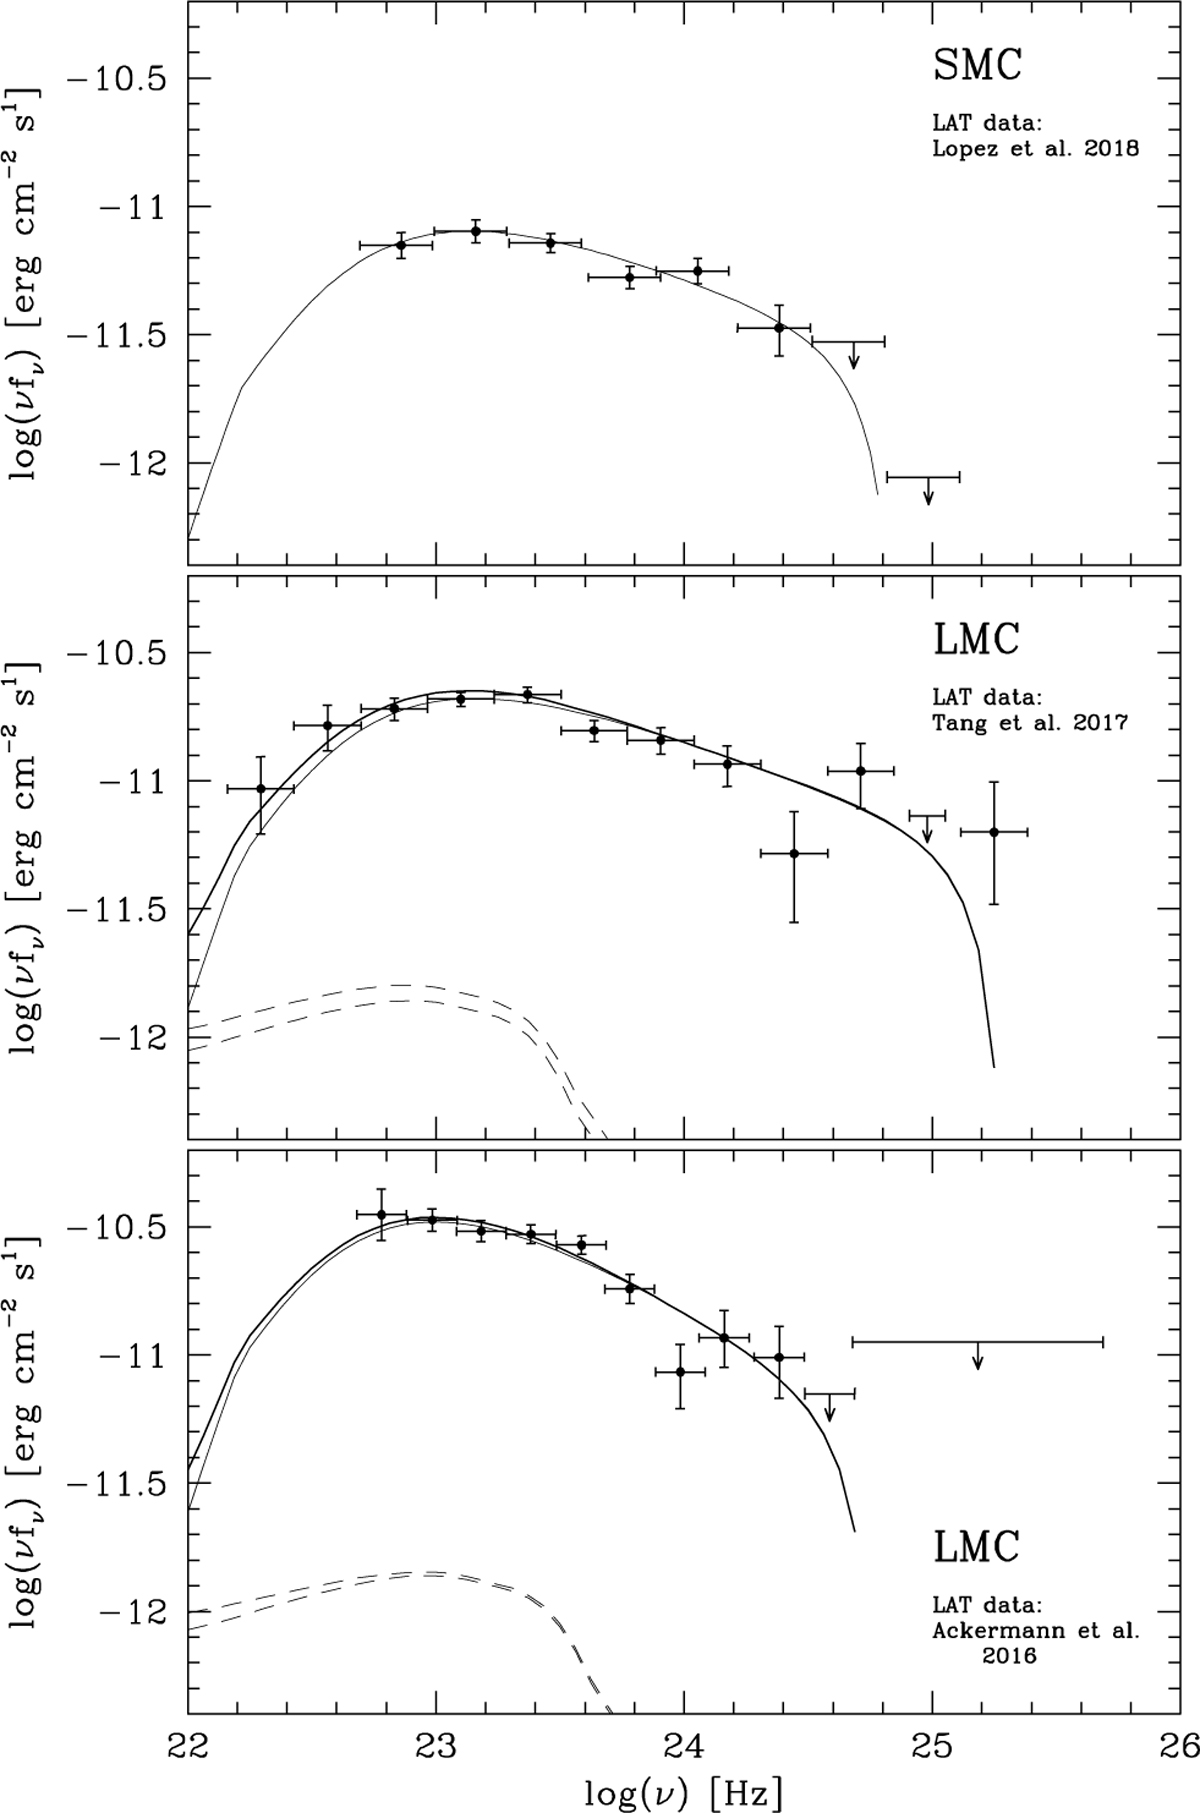
Fig. 1
Download original image
Gamma-ray spectra in the Magellanic Clouds. Curves represent: (top) pionic emission, solid; (middle and bottom, in decreasing flux): total gamma and pionic emissions, solid, and total and primary NT bremsstrahlung, dashed.
Current usage metrics show cumulative count of Article Views (full-text article views including HTML views, PDF and ePub downloads, according to the available data) and Abstracts Views on Vision4Press platform.
Data correspond to usage on the plateform after 2015. The current usage metrics is available 48-96 hours after online publication and is updated daily on week days.
Initial download of the metrics may take a while.