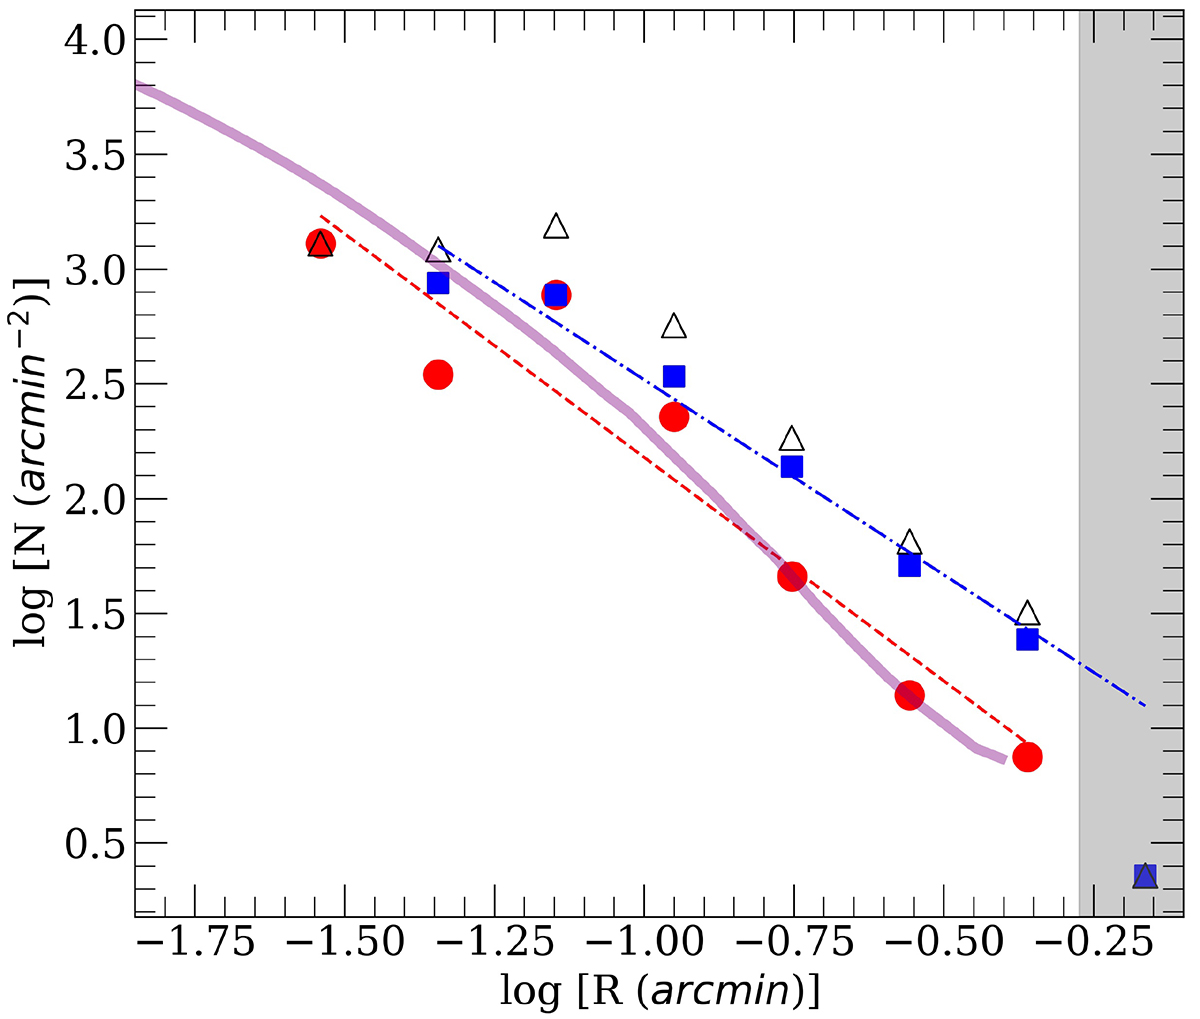
Fig. 8.
Download original image
Radial densities of the full (black triangles), red (red circles), and blue (blue squares) GC populations in PGC 087327. The radial density profile for the red (dashed line) and blue (dot-dashed line) GC populations is also shown as a linear trend. The radial surface brightness profile of the galaxy (scaled appropriately) is shown with the purple solid line. The shaded grey region shows the limit of geometric completeness as we approach the margins of our image cutout.
Current usage metrics show cumulative count of Article Views (full-text article views including HTML views, PDF and ePub downloads, according to the available data) and Abstracts Views on Vision4Press platform.
Data correspond to usage on the plateform after 2015. The current usage metrics is available 48-96 hours after online publication and is updated daily on week days.
Initial download of the metrics may take a while.