Open Access
Fig. 7.
Download original image
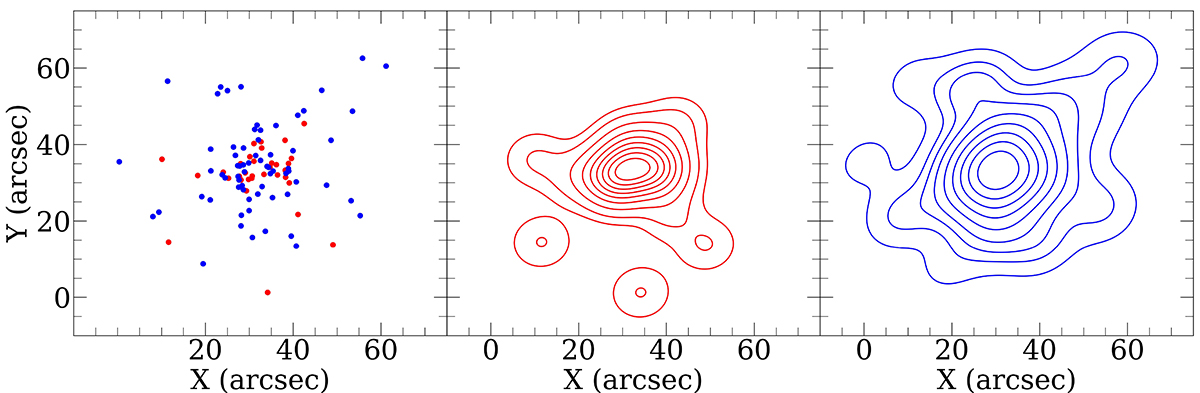
Spatial distribution of the GC candidates divided into red and blue according to colour (⟨gF475W − VF606W⟩≥0.53 is red) in the frame of PGC 087327 (left) and the KDE plot of the blue (center) and red (right) GC sub-populations.
Current usage metrics show cumulative count of Article Views (full-text article views including HTML views, PDF and ePub downloads, according to the available data) and Abstracts Views on Vision4Press platform.
Data correspond to usage on the plateform after 2015. The current usage metrics is available 48-96 hours after online publication and is updated daily on week days.
Initial download of the metrics may take a while.