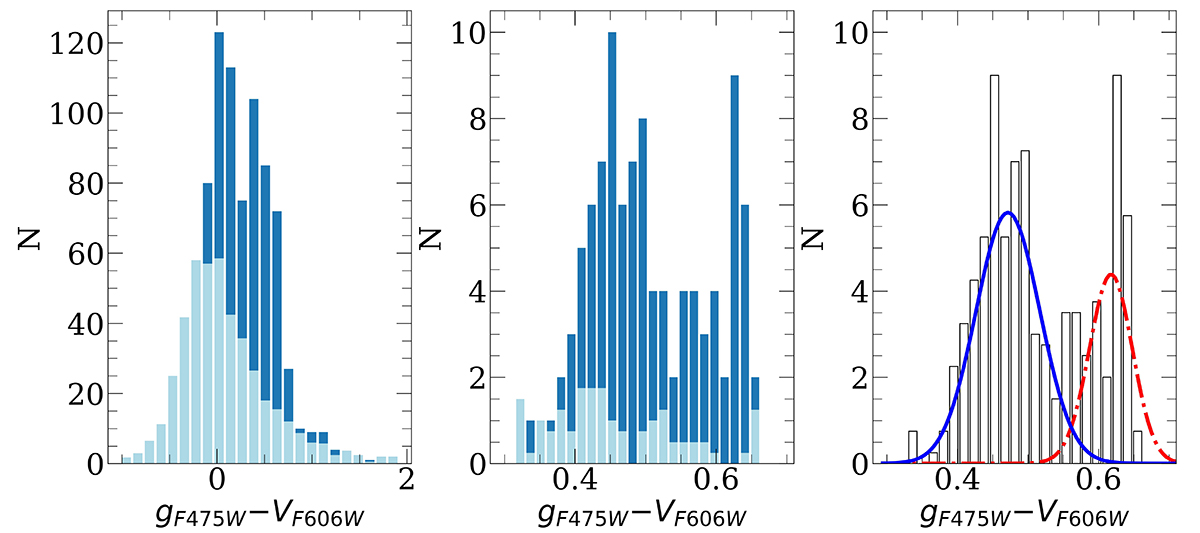
Fig. 6.
Download original image
Colour histograms of the full matched sample (left panel) and of the GC candidates (center) as well as the colour distribution of GCs over PGC 087327 corrected for the background contamination (right). The light blue histograms in the left and central panels indicate mean colour distributions in the background frames, and the dark blue histograms represent the distribution in the frame of PGC 087327. In the right panel the Gaussian fits (from GMM) for the blue (solid blue line) and red (dot-dashed red line) GC sub-populations are overlaid on the background-corrected colour density histogram.
Current usage metrics show cumulative count of Article Views (full-text article views including HTML views, PDF and ePub downloads, according to the available data) and Abstracts Views on Vision4Press platform.
Data correspond to usage on the plateform after 2015. The current usage metrics is available 48-96 hours after online publication and is updated daily on week days.
Initial download of the metrics may take a while.