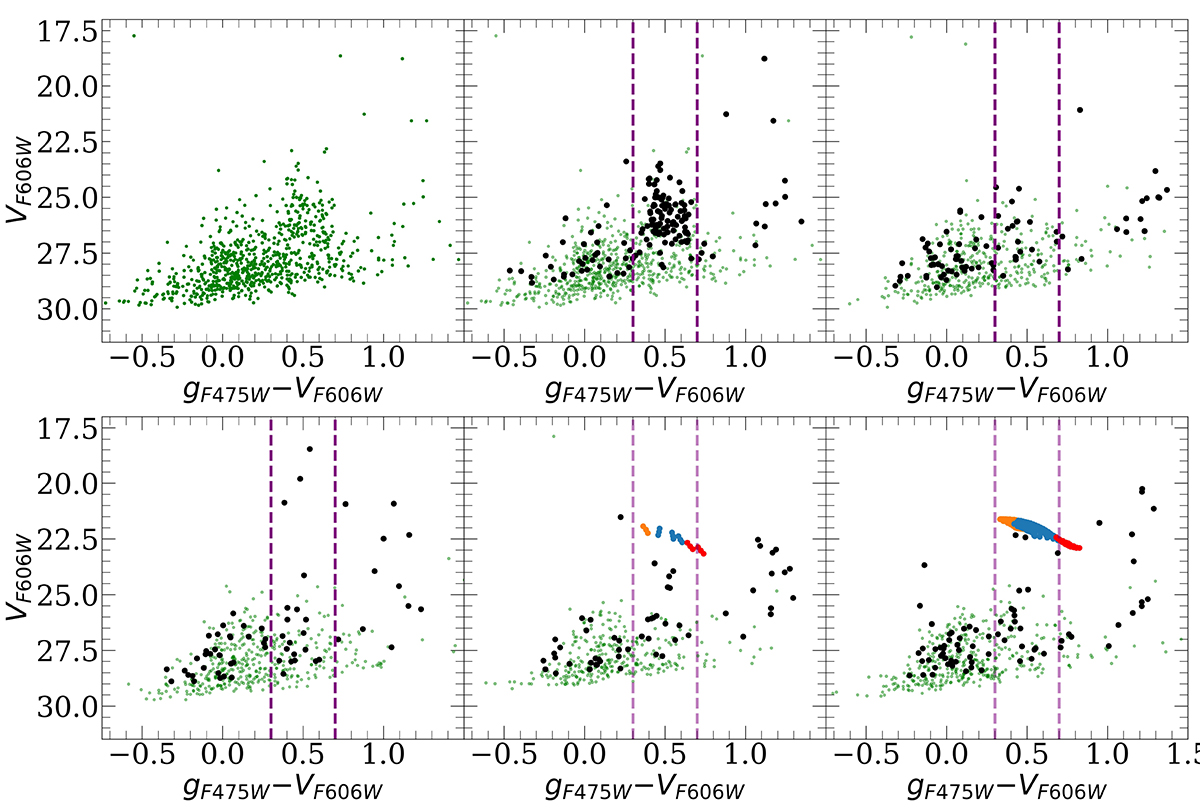
Fig. 5.
Download original image
Colour-magnitude diagram of all objects detected (green; top left), along with the objects selected by compactness criteria (black) in the PGC 087327 frame (top center), and background reference frames (all others). The GC candidates are the compact objects (black) within the colour interval marked by purple dashed vertical lines in all panels. The bottom two panels also show the SPoT (bottom left panel) and YEPS (bottom right panel) SSP models (with an arbitrary magnitude shift) overlaid on top of the colour-magnitude plots for regions 3 and 4. Different SSP [Fe/H] are shown with different colours : −2.5 ≤ [Fe/H] ≤ − 1.5 in orange, −1.5 < [Fe/H] ≤ 0 in blue, and 0 < [Fe/H] ≤ 0.5 in red. The vertical dotted lines in the middle panel show the colour interval adopted for GC selection.
Current usage metrics show cumulative count of Article Views (full-text article views including HTML views, PDF and ePub downloads, according to the available data) and Abstracts Views on Vision4Press platform.
Data correspond to usage on the plateform after 2015. The current usage metrics is available 48-96 hours after online publication and is updated daily on week days.
Initial download of the metrics may take a while.