Open Access
Fig. 10.
Download original image
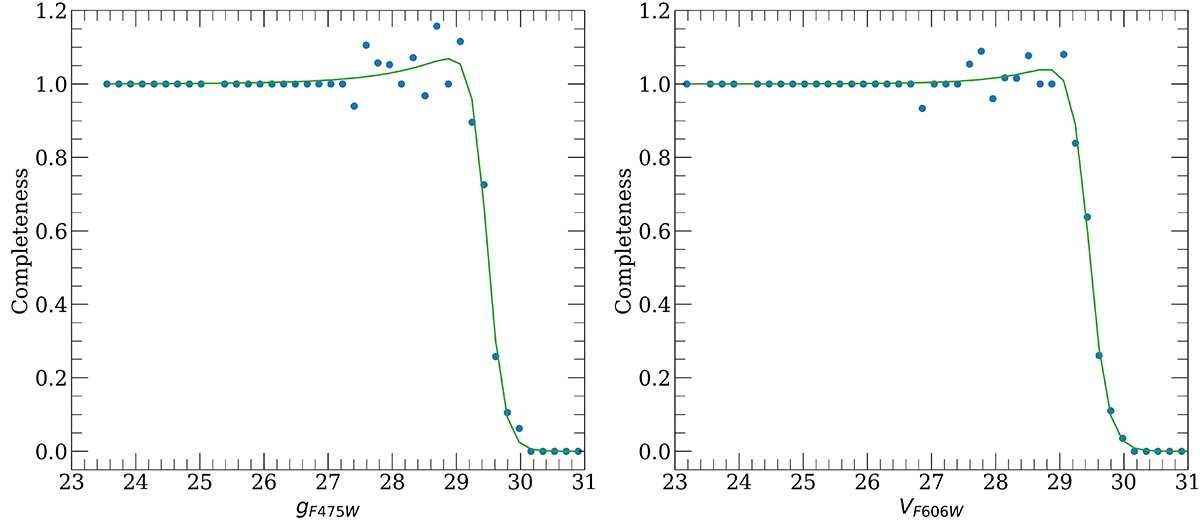
Completeness functions in gF475W (left) and VF606W (right). Each point represents the ratio of the number of sources detected vs. injected, in each magnitude bin, and the green line shows the best fit modified Fermi function.
Current usage metrics show cumulative count of Article Views (full-text article views including HTML views, PDF and ePub downloads, according to the available data) and Abstracts Views on Vision4Press platform.
Data correspond to usage on the plateform after 2015. The current usage metrics is available 48-96 hours after online publication and is updated daily on week days.
Initial download of the metrics may take a while.