Open Access
Fig. 9
Download original image
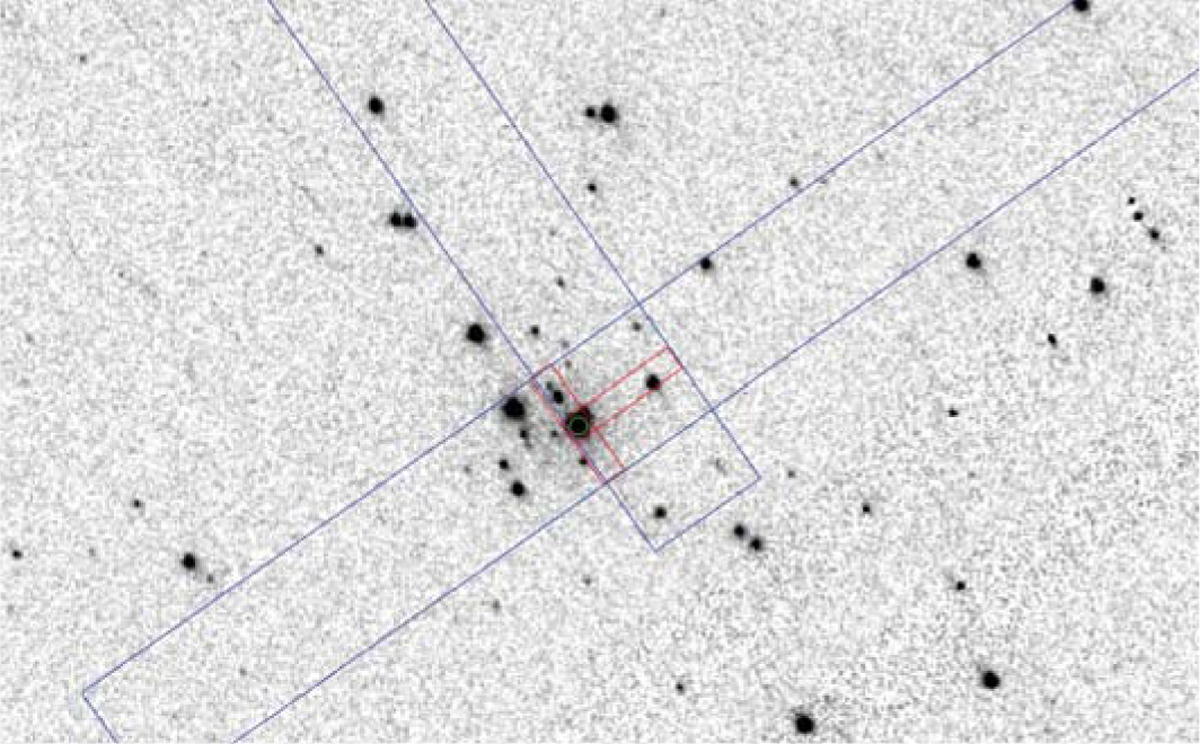
Area on the sky around SSN 14. Blue boxes show the approximate positions of the two G140L slits with 2″ widths, while red boxes show the position along the slit from where the spectra of SSN 14 were extracted. Background is the F225W HST image, flux is log scaled.
Current usage metrics show cumulative count of Article Views (full-text article views including HTML views, PDF and ePub downloads, according to the available data) and Abstracts Views on Vision4Press platform.
Data correspond to usage on the plateform after 2015. The current usage metrics is available 48-96 hours after online publication and is updated daily on week days.
Initial download of the metrics may take a while.