Fig. D.1
Download original image
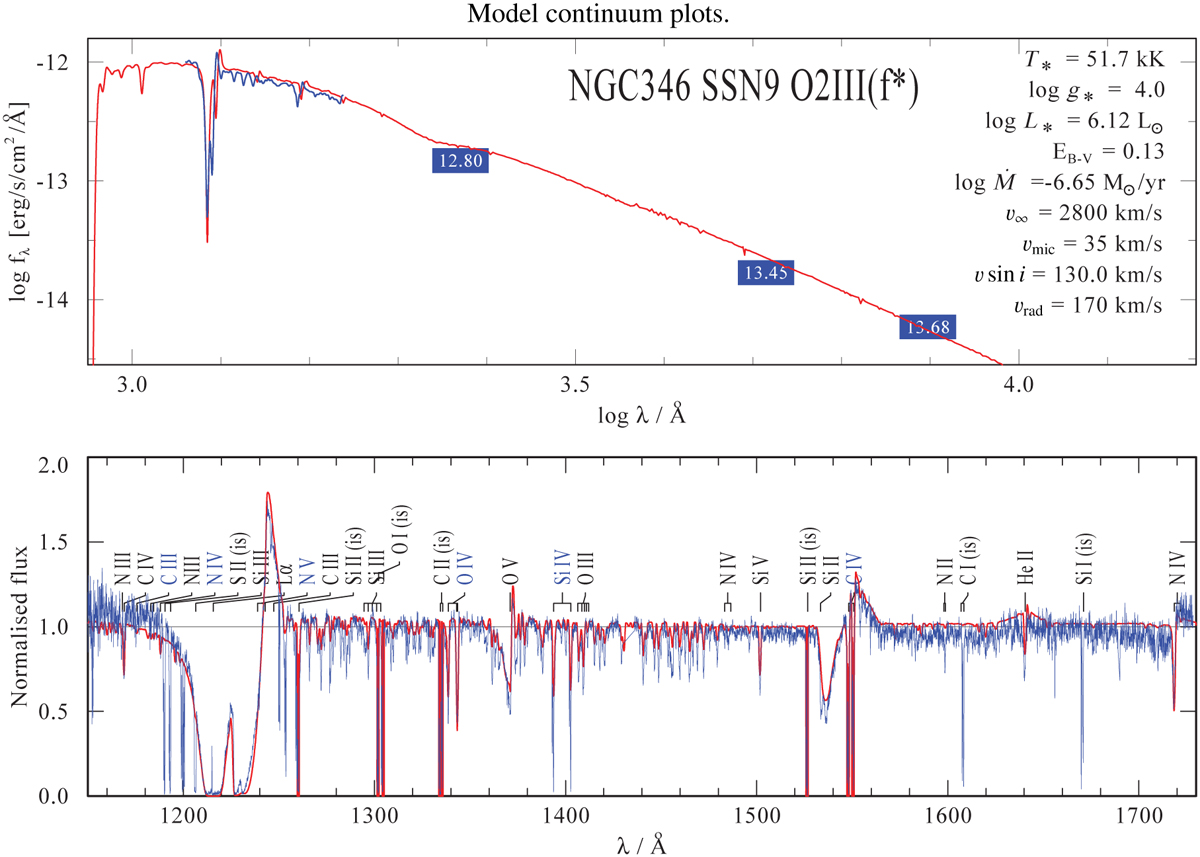
Spectral model fit of SSN 9. Top panel: SED fit of the model (red) to the flux calibrated observations of HST-STIS (blue). The blue squares with numbers mark the measure photometric data from Sabbi et al. (2007) which are used as additional constraints for the SED fit. Middle panel: Normalised HST-STIS spectrum (blue) overplotted by our synthetic spectrum (red). Lower panels: Same as the panel above, but now zoomed on the N v, O v and C iv UV resonance lines.
Current usage metrics show cumulative count of Article Views (full-text article views including HTML views, PDF and ePub downloads, according to the available data) and Abstracts Views on Vision4Press platform.
Data correspond to usage on the plateform after 2015. The current usage metrics is available 48-96 hours after online publication and is updated daily on week days.
Initial download of the metrics may take a while.