Fig. 14
Download original image
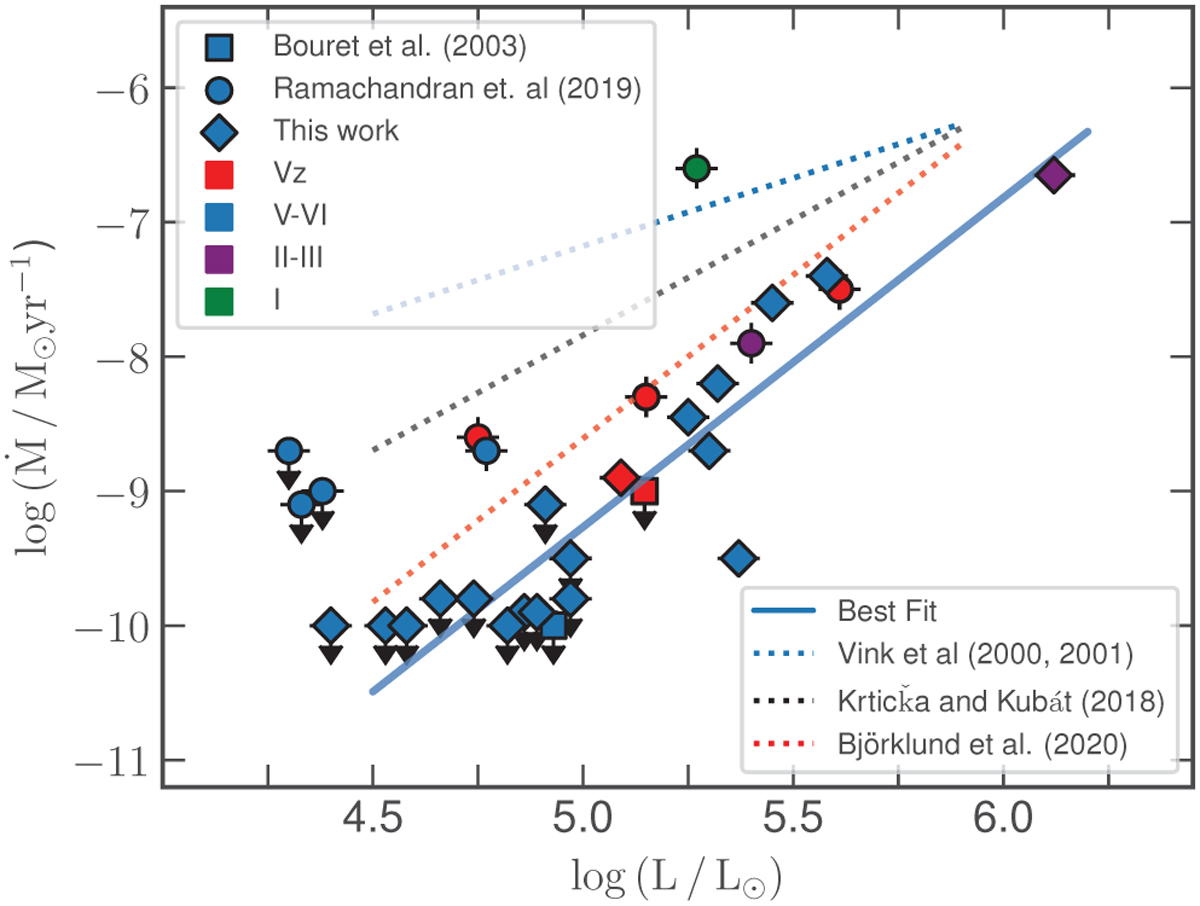
Mass-loss rate as a function of stellar luminosity for the analysed O stars in NGC 346. Luminosity classes are distinguished by different colours as given in the legend. A power-law fit to the empirical results is represented by the blue solid line (see Sect. 4.2 for details). For comparison, we include stars with ![]() from UV observations from Ramachandran et al. (2019) (circles), two additional objects within NGC 346 with
from UV observations from Ramachandran et al. (2019) (circles), two additional objects within NGC 346 with ![]() from Bouret et al. (2003) (squares) and the theoretical SMC predictions from Vink et al. (2000, 2001) (dashed blue line), Krtička & Kubát (2018) (black dashed line) and Björklund et al. (2021) (dashed red line).
from Bouret et al. (2003) (squares) and the theoretical SMC predictions from Vink et al. (2000, 2001) (dashed blue line), Krtička & Kubát (2018) (black dashed line) and Björklund et al. (2021) (dashed red line).
Current usage metrics show cumulative count of Article Views (full-text article views including HTML views, PDF and ePub downloads, according to the available data) and Abstracts Views on Vision4Press platform.
Data correspond to usage on the plateform after 2015. The current usage metrics is available 48-96 hours after online publication and is updated daily on week days.
Initial download of the metrics may take a while.