Fig. 13
Download original image
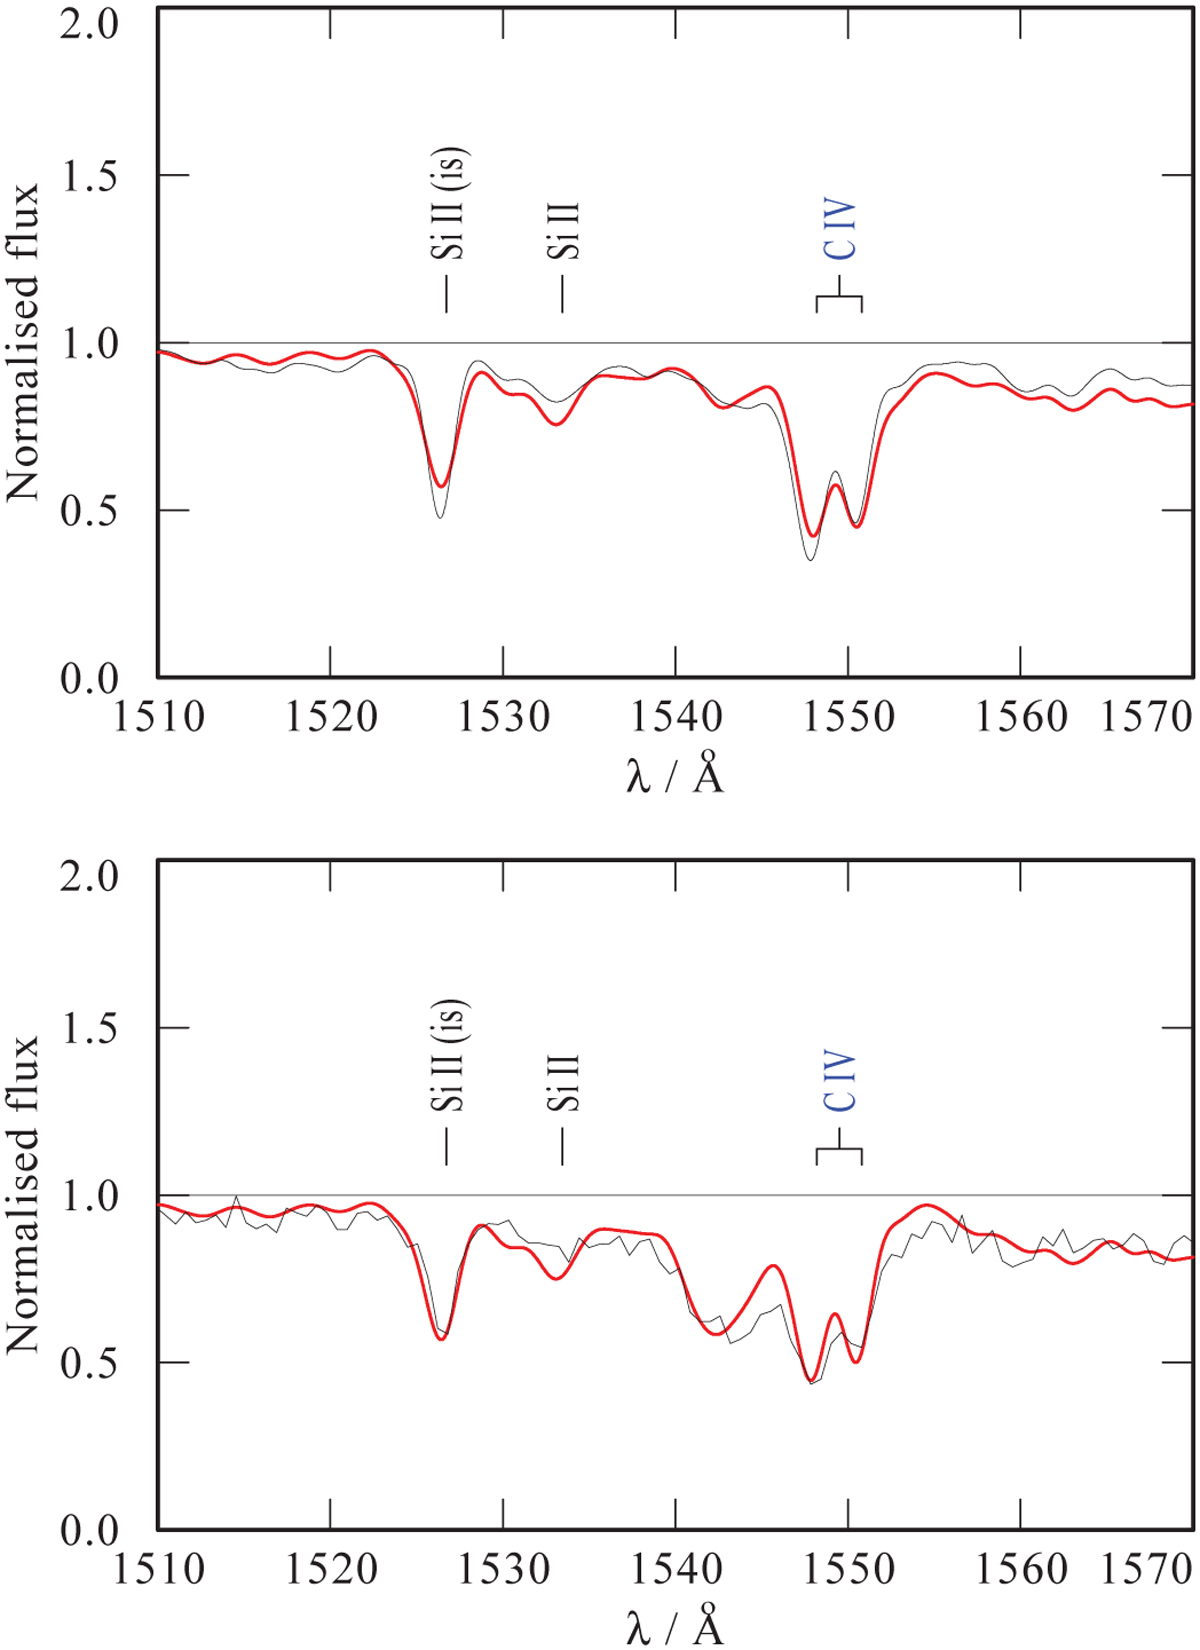
Two seperate normalised spectral observations of the C iv λλ 1548, 1551 wind lines of SSN 18, normalised and compared to various models. The observations are shown by the black lines. Red lines are models. Top panel: high resolution E140M observations of SSN 18 (obtained on 28-09-2000) compared to a model with ![]() , convolved to the same resolution as the model in the lower panel. Lower panel: low resolution G140L spectrum of the same target (obtained on 30-12-2018) compared to a model with
, convolved to the same resolution as the model in the lower panel. Lower panel: low resolution G140L spectrum of the same target (obtained on 30-12-2018) compared to a model with ![]() .
.
Current usage metrics show cumulative count of Article Views (full-text article views including HTML views, PDF and ePub downloads, according to the available data) and Abstracts Views on Vision4Press platform.
Data correspond to usage on the plateform after 2015. The current usage metrics is available 48-96 hours after online publication and is updated daily on week days.
Initial download of the metrics may take a while.