Fig. 10
Download original image
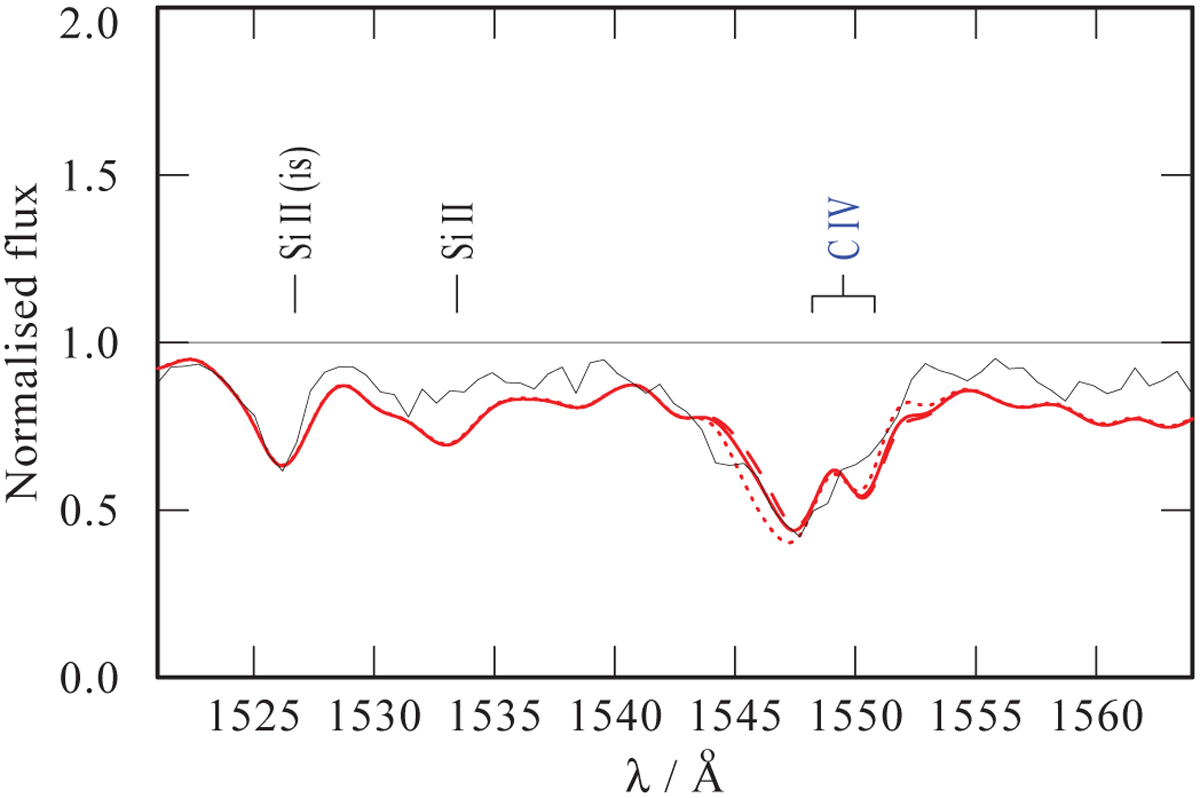
Spectral observations of wind lines of SSN 14, normalised and compared to various models. The observed spectra of SSN 14 is shown by black line. Synthetic spectra with ![]() shown by solid red line. The dotted red line shows model spectra with
shown by solid red line. The dotted red line shows model spectra with ![]() while the dashed red line shows the spectra with
while the dashed red line shows the spectra with ![]() . All shown models have v∞ = 600 km s−1 and D = 20.
. All shown models have v∞ = 600 km s−1 and D = 20.
Current usage metrics show cumulative count of Article Views (full-text article views including HTML views, PDF and ePub downloads, according to the available data) and Abstracts Views on Vision4Press platform.
Data correspond to usage on the plateform after 2015. The current usage metrics is available 48-96 hours after online publication and is updated daily on week days.
Initial download of the metrics may take a while.