Fig. 3.
Download original image
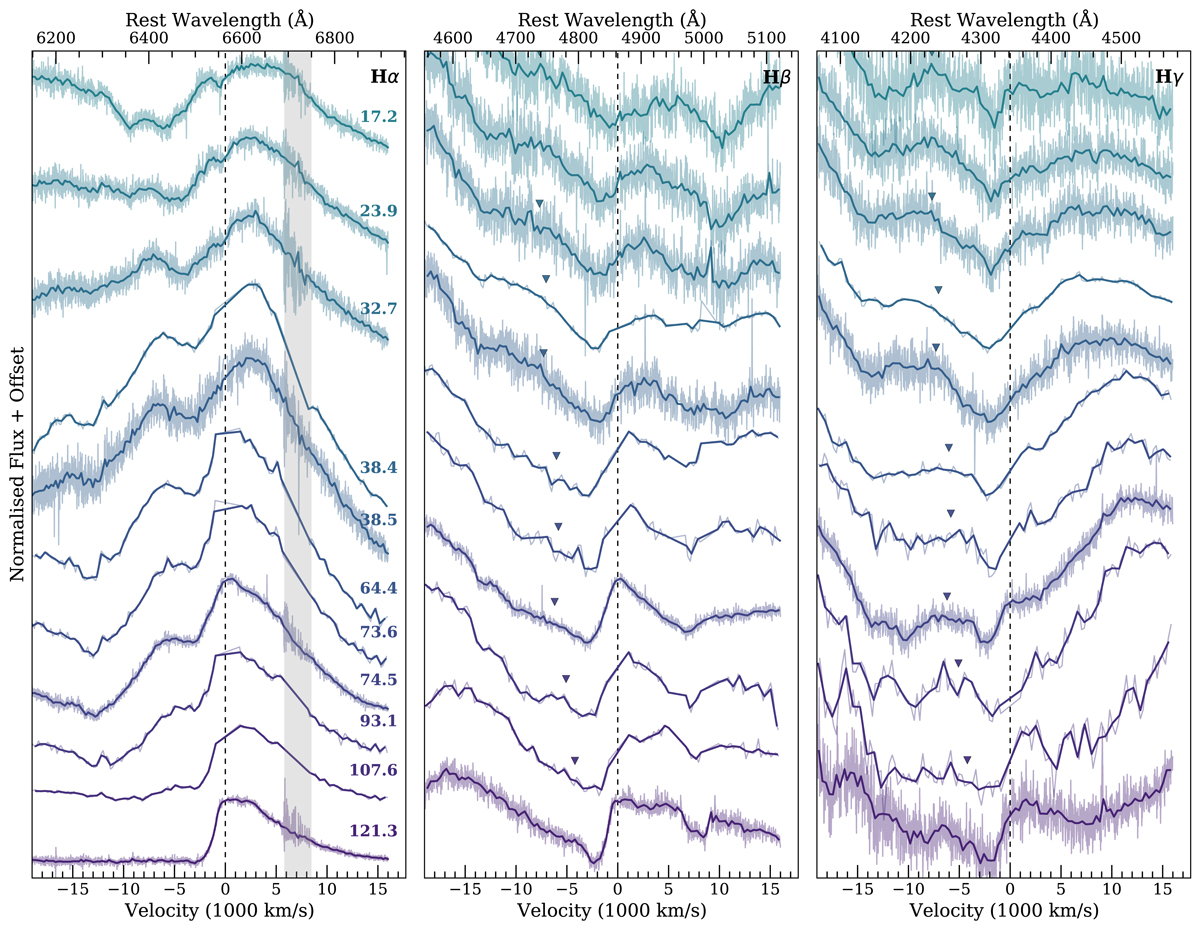
Same as Fig. 2 but for Hα, Hβ, and Hγ starting from 17.2 d post-maximum. The corresponding location of the blue Hα component has been marked for Hβ and Hγ with triangles. Note that continuum subtraction has not been applied to any of the displayed line profiles due to the presence of the strong Mg IIλ4481 line affecting both Hβ and Hγ.
Current usage metrics show cumulative count of Article Views (full-text article views including HTML views, PDF and ePub downloads, according to the available data) and Abstracts Views on Vision4Press platform.
Data correspond to usage on the plateform after 2015. The current usage metrics is available 48-96 hours after online publication and is updated daily on week days.
Initial download of the metrics may take a while.