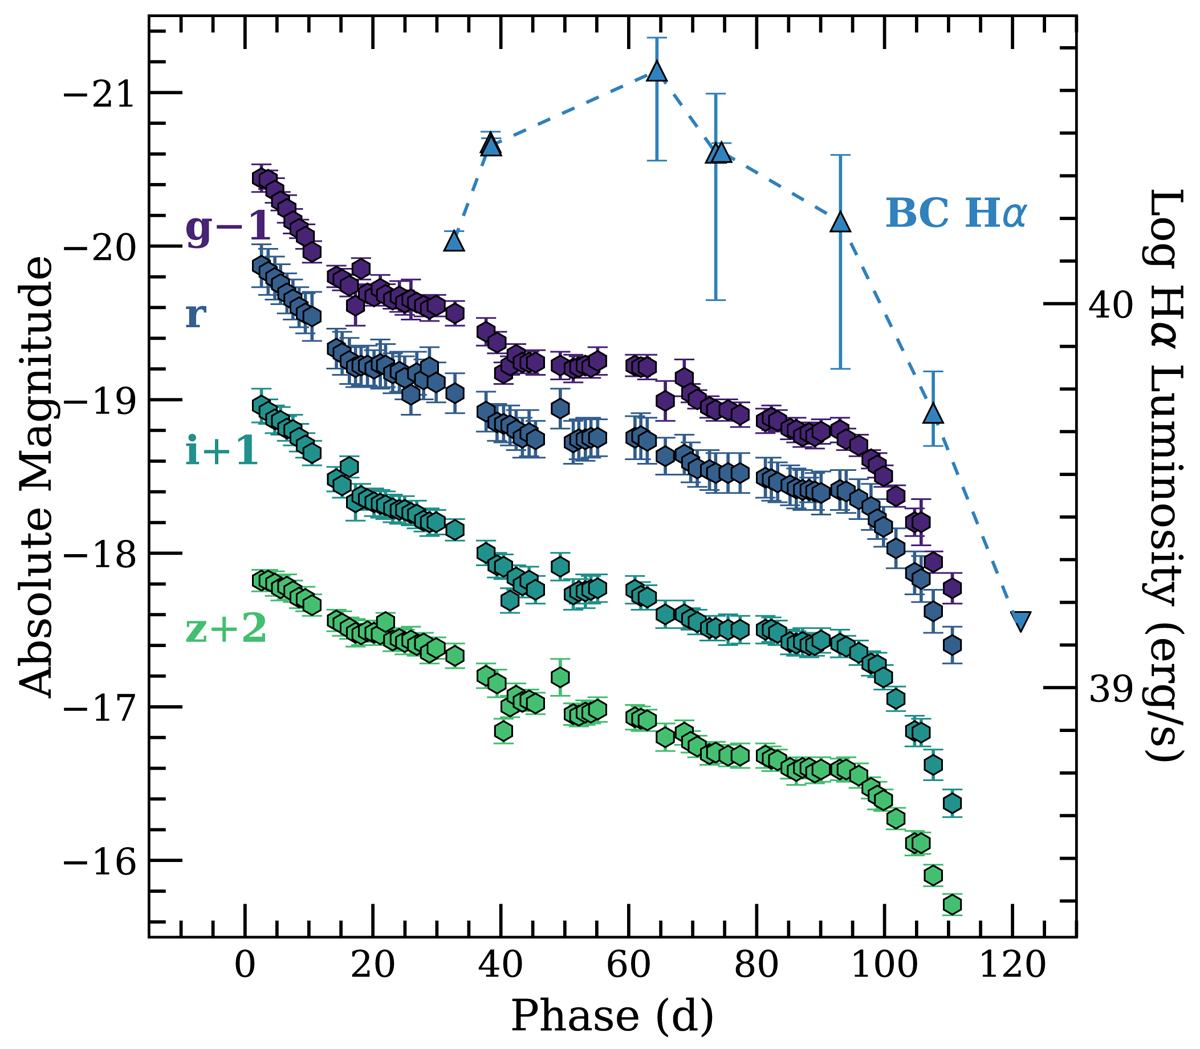
Fig. 23.
Download original image
GROND g′, r′, i′, and z′ absolute magnitude light curves of SN 2018bsz (Chen et al. 2021) in comparison to the integrated luminosity of the blue Hα component (BC). The blue component becomes fainter simultaneously with the light curve at ∼100 d. The Hα luminosities were estimated based on the Gaussian fits described in Sect. 3.2. At 121.3 d no emission component was seen and the stated value is a 2σ upper limit for the non-detection shown with a downward triangle. Note that the axis scales are set so that 2.5 mag = 1Log(L).
Current usage metrics show cumulative count of Article Views (full-text article views including HTML views, PDF and ePub downloads, according to the available data) and Abstracts Views on Vision4Press platform.
Data correspond to usage on the plateform after 2015. The current usage metrics is available 48-96 hours after online publication and is updated daily on week days.
Initial download of the metrics may take a while.