Fig. 2.
Download original image
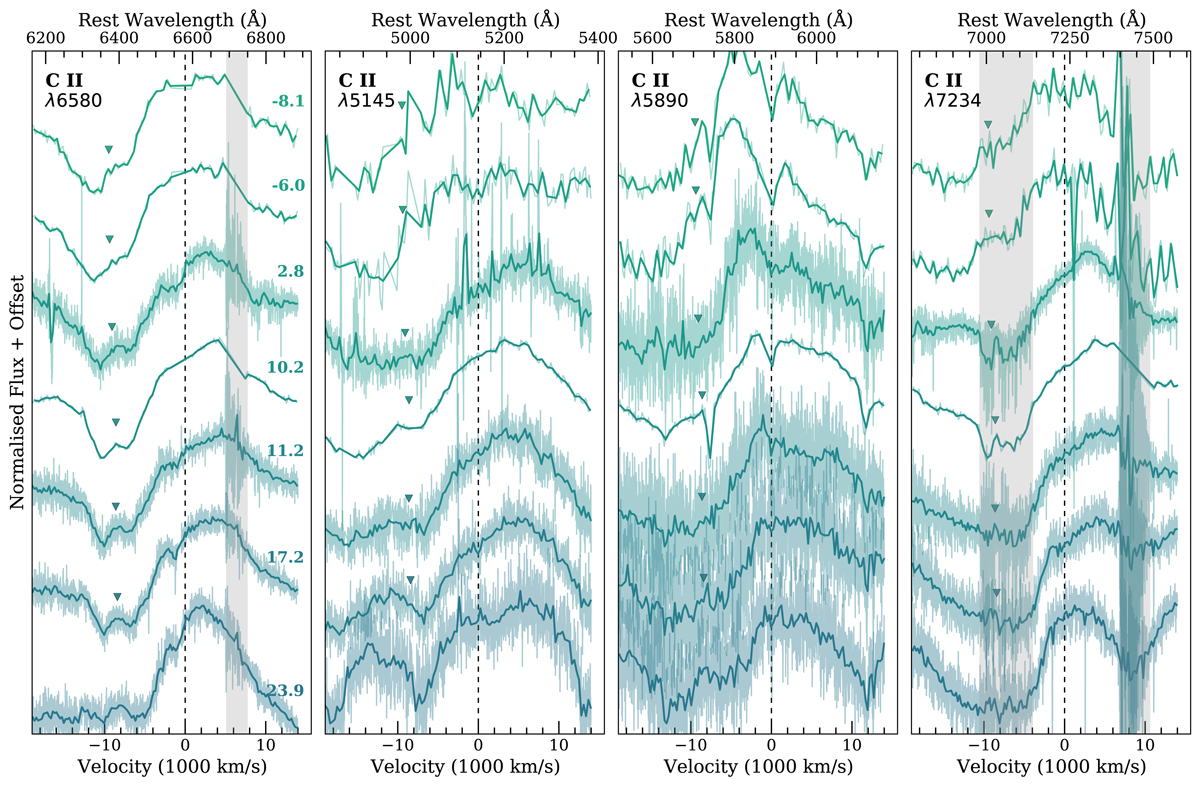
Spectral time series of C IIλλ6580, 5145, 5890, 7234 up to 24 d post-maximum. Both the original spectra (lighter shade) and spectra binned to 5 Å (darker shade) are shown. The location of the (high-velocity) HV emission feature next to C IIλ6580 and the corresponding locations for λλ5145, 5890, 7234 have been marked with triangles. The feature appears to be present only for C IIλ6580. The line strengths from minimum to maximum are scaled to be equal to investigate the evolution of the line profiles. Regions of strong telluric absorption are indicated with grey bands. Note that a linear continuum subtraction has been applied to the displayed spectra to highlight the similarity of the profiles.
Current usage metrics show cumulative count of Article Views (full-text article views including HTML views, PDF and ePub downloads, according to the available data) and Abstracts Views on Vision4Press platform.
Data correspond to usage on the plateform after 2015. The current usage metrics is available 48-96 hours after online publication and is updated daily on week days.
Initial download of the metrics may take a while.