Fig. 18.
Download original image
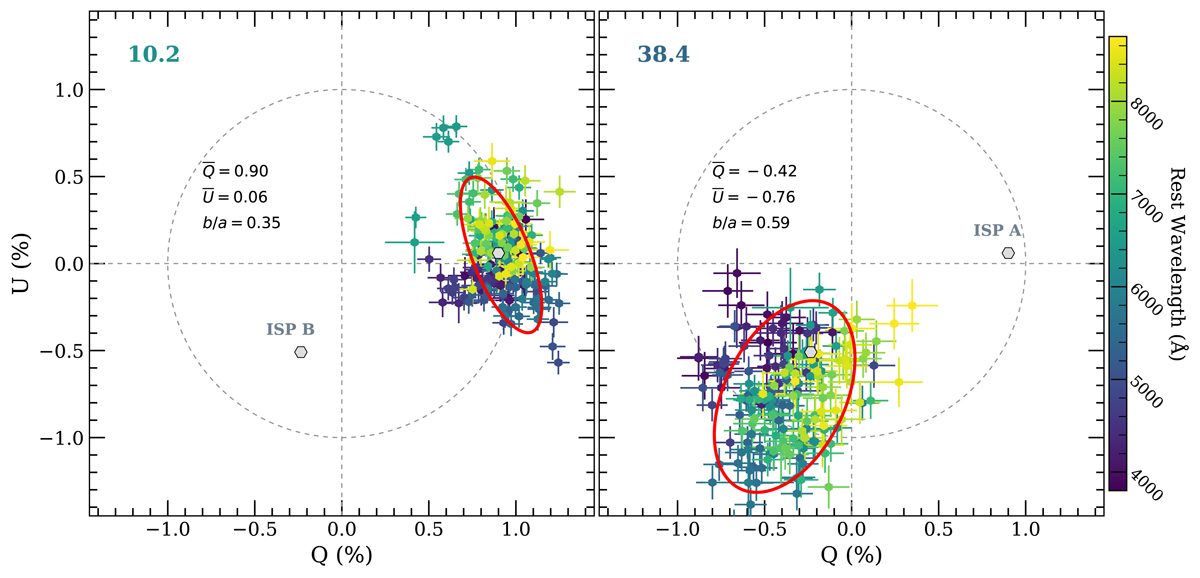
Location of SN 2018bsz on the Q – U plane at 10.2 d (left) and 38.4 d (right). The individual points are coloured according to their wavelength as indicated in the colour bar. Thin dashed lines have been drawn at Q = 0, U = 0 and P = 1 to guide the eye. The two ellipses in red are the outcome of a principal component analysis (Maund et al. 2010) where the major axis of the ellipse is aligned with the direction of the maximum variance of the data and the axial ratio b/a parameterises the ratio of polarisation carried by the orthogonal to the dominant direction (minor to major axis). The locations of two alternative ISP solutions that have been examined (ISP A and ISP B; see Sect. 5.1) have been marked with grey hexagons, but the data have not been corrected for any ISP. There is a large change in the SN polarisation between the two epochs shown the large shift in the barycentre (![]() ,
, ![]() ), which is independent of the ISP. Such large changes on the Q – U plane have rarely been observed for SN explosions.
), which is independent of the ISP. Such large changes on the Q – U plane have rarely been observed for SN explosions.
Current usage metrics show cumulative count of Article Views (full-text article views including HTML views, PDF and ePub downloads, according to the available data) and Abstracts Views on Vision4Press platform.
Data correspond to usage on the plateform after 2015. The current usage metrics is available 48-96 hours after online publication and is updated daily on week days.
Initial download of the metrics may take a while.