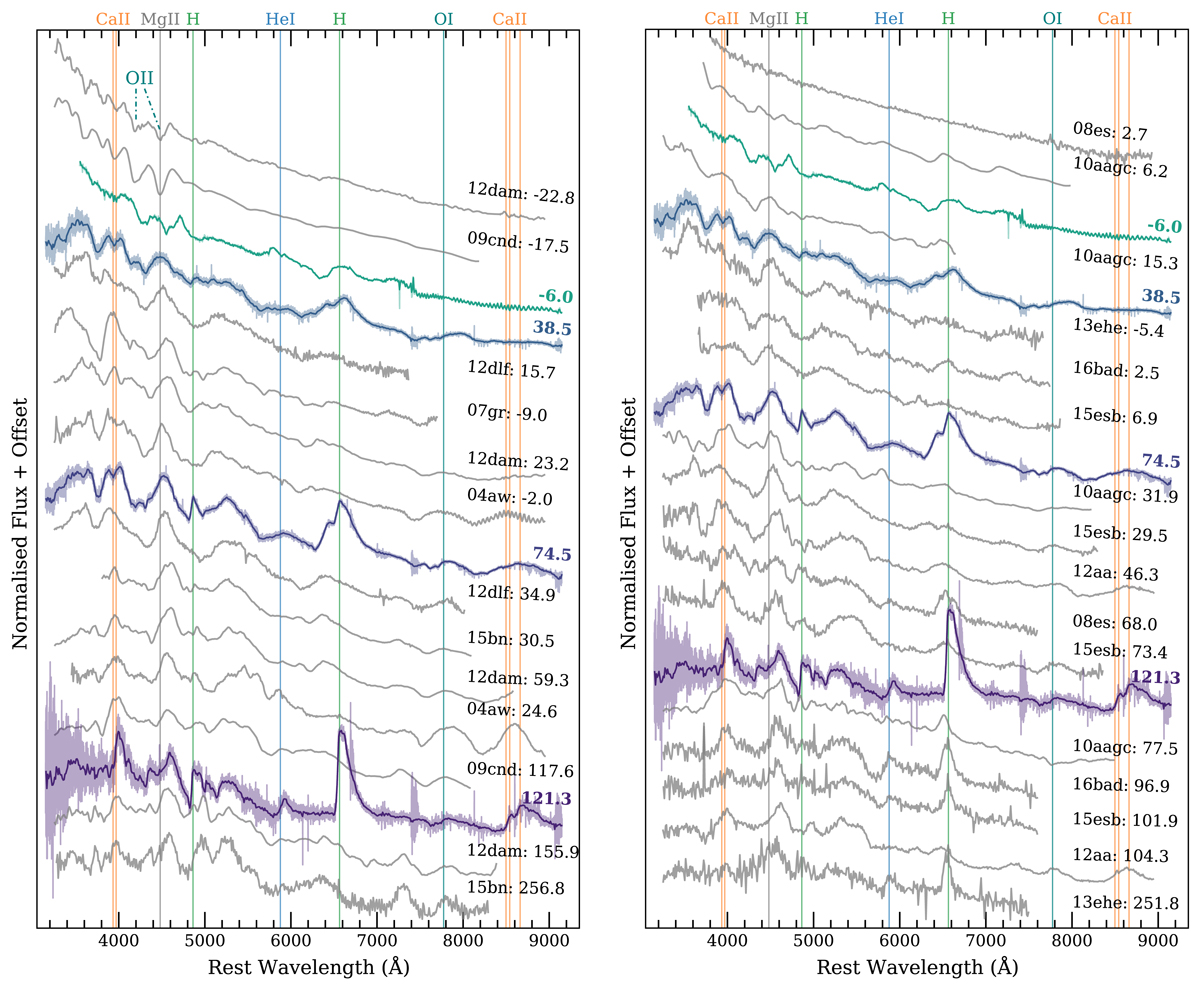
Fig. 14.
Download original image
SN 2018bsz spectral evolution in comparison to literature SESNe and SLSNe-I (left) and in comparison to SLSNe-I with detected Hα emission and SLSN-II 2008es (right). All spectra have been binned to 10 Å, but unbinned spectra are shown for SN 2018bsz. SN 2018bsz is spectroscopically similar to SESNe and SLSN-I, but the Balmer lines are unique even for SLSNe-I with late H emission. We note that the literature spectra have been mangled to have the same colour as SN 2018bsz at a relevant epoch to ease the comparison. The literature spectra were first published in the following papers: SN 2004aw (Taubenberger et al. 2006), SN 2007gr (Valenti et al. 2008), SN 2008es (Miller et al. 2009), PTF09cnd (Quimby et al. 2011, see also Quimby et al. 2018), PTF10aagc (Quimby et al. 2018), PTF12dam (Quimby et al. 2018), LSQ12dlf (Nicholl et al. 2014), SN 2012aa (Roy et al. 2016), iPTF13ehe (Yan et al. 2015), SN 2015bn (Nicholl et al. 2016) and iPTF15esb and iPTF16bad (Yan et al. 2017), and the data were downloaded from the Open Supernova Catalog (Guillochon et al. 2017) and WISeREP (Yaron & Gal-Yam 2012).
Current usage metrics show cumulative count of Article Views (full-text article views including HTML views, PDF and ePub downloads, according to the available data) and Abstracts Views on Vision4Press platform.
Data correspond to usage on the plateform after 2015. The current usage metrics is available 48-96 hours after online publication and is updated daily on week days.
Initial download of the metrics may take a while.