Fig. 1.
Download original image
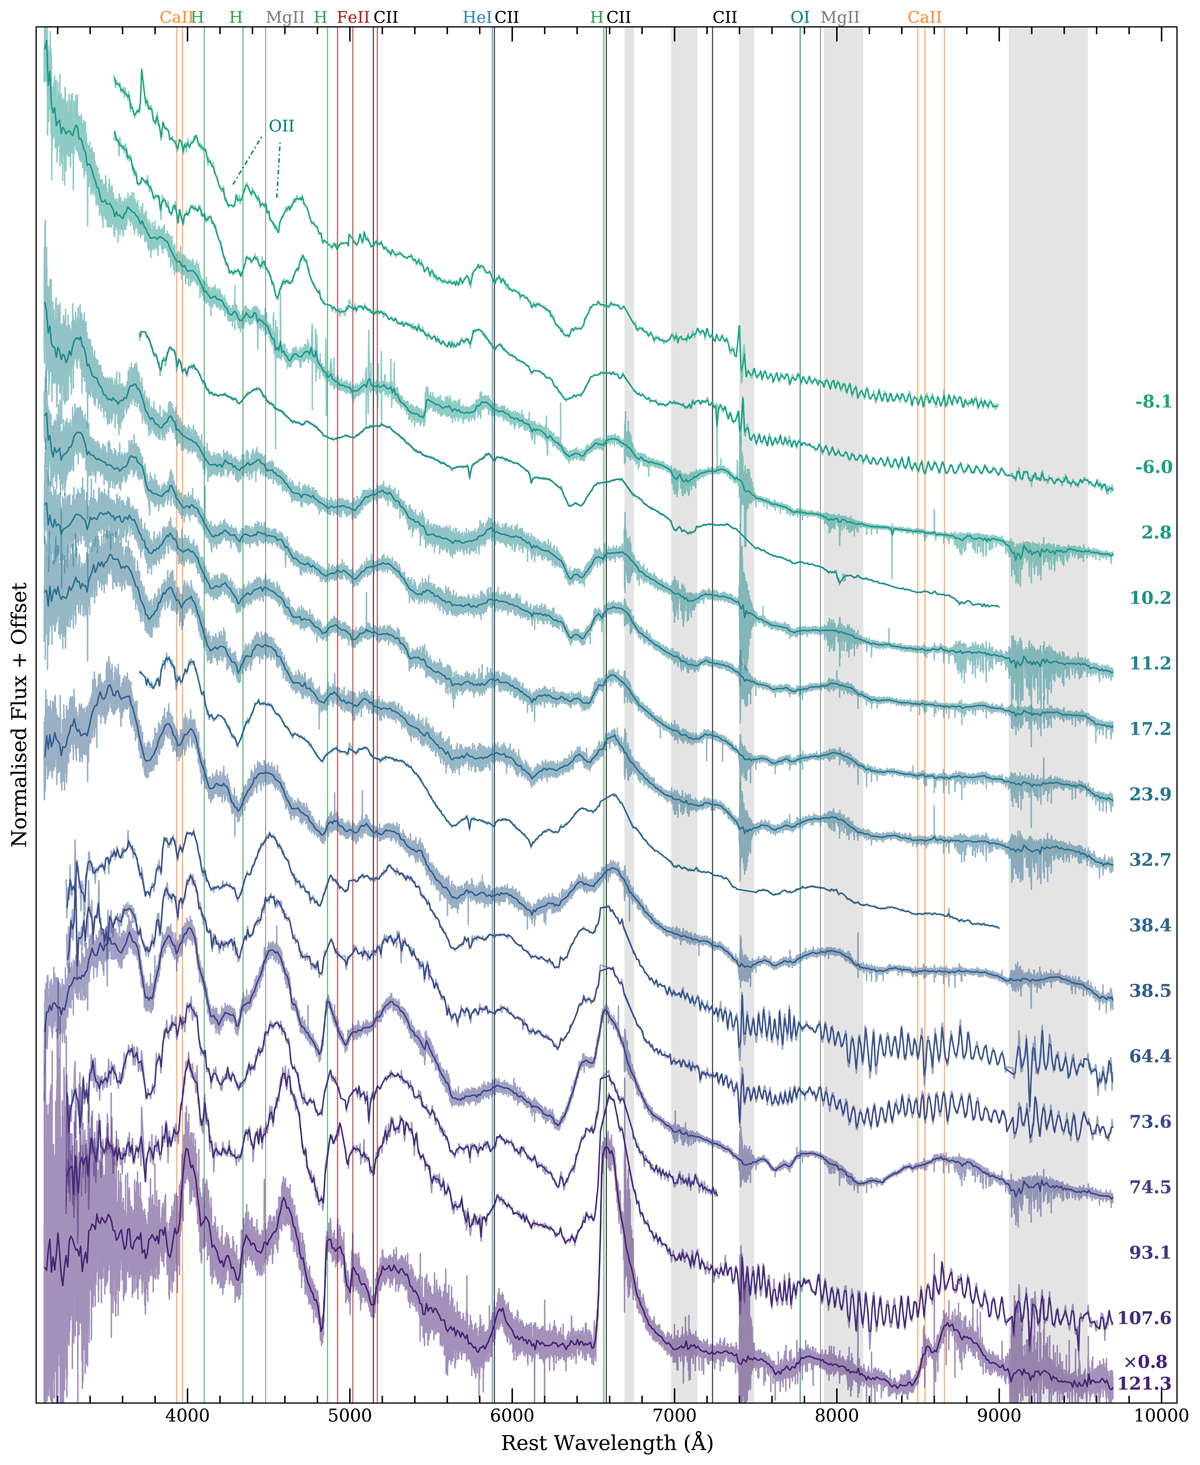
Spectral time series of SN 2018bsz. Both the original spectra (lighter shade) and spectra binned to 10 Å (darker shade) are shown. Significant emission line features have been highlighted with vertical lines. The most significant transition in the spectral sequence occurs at ∼30 d, when the C II features have faded and the Balmer emission lines start to appear. Regions of strong telluric absorption are highlighted with grey bands. The host galaxy lines have been clipped in order to focus on the transient. The spectra have been normalised by the average flux of each spectra. Note that the spectrum at 121.3 d has been multiplied by 0.8 for clarity.
Current usage metrics show cumulative count of Article Views (full-text article views including HTML views, PDF and ePub downloads, according to the available data) and Abstracts Views on Vision4Press platform.
Data correspond to usage on the plateform after 2015. The current usage metrics is available 48-96 hours after online publication and is updated daily on week days.
Initial download of the metrics may take a while.