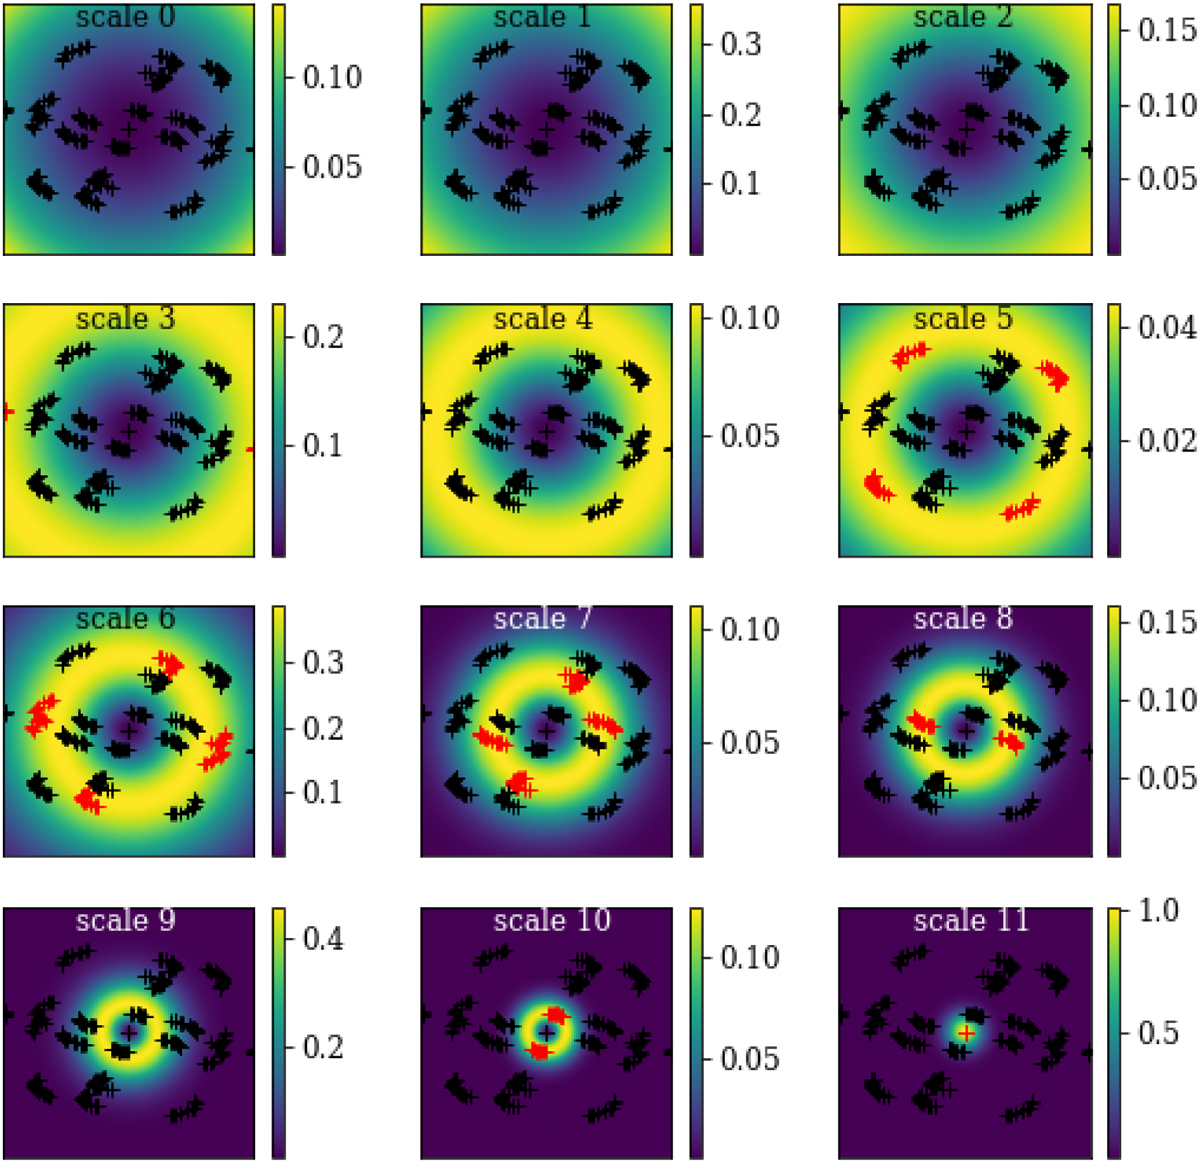
Fig. 2
Download original image
Observed uv-coverage (black and red points) of the EHT data array (observation of M 87 on 5 April 2017) and masks defined by the DoG wavelets listed in Table 3 (color maps). The masks are the Fourier transform of the respective wavelets and they define ring-like filters in Fourier domain. The visibilities highlighted by a specific filter are plotted in red.
Current usage metrics show cumulative count of Article Views (full-text article views including HTML views, PDF and ePub downloads, according to the available data) and Abstracts Views on Vision4Press platform.
Data correspond to usage on the plateform after 2015. The current usage metrics is available 48-96 hours after online publication and is updated daily on week days.
Initial download of the metrics may take a while.