Fig. 7
Download original image
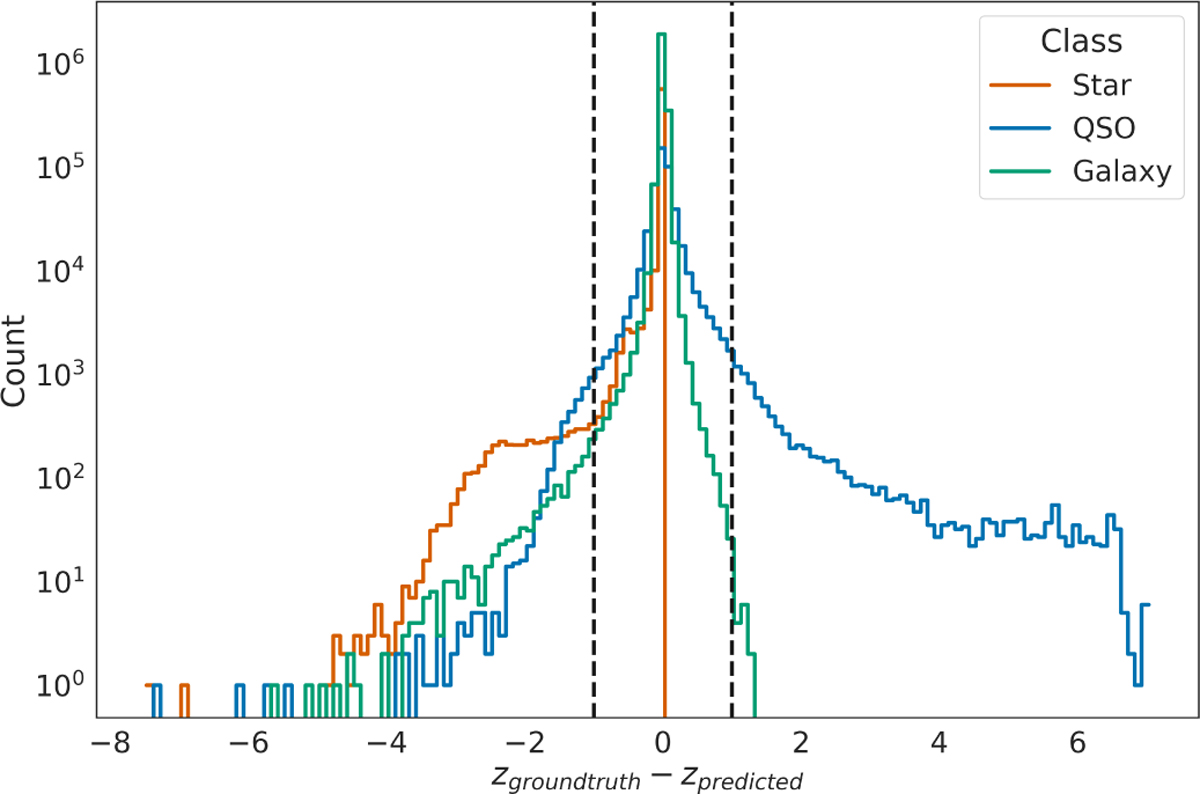
Distribution of the difference between the spectroscopic redshift (zgroundtruth) provided by SDSS spectroscopy and the photometric redshift predicted in our work (zprediCted). The histogram is colour-coded by spec-troscopic label: orange for stars, blue for QSOs, and green for galaxies. The black dashed lines delimit the area where the difference between redshifts is 1 or −1.
Current usage metrics show cumulative count of Article Views (full-text article views including HTML views, PDF and ePub downloads, according to the available data) and Abstracts Views on Vision4Press platform.
Data correspond to usage on the plateform after 2015. The current usage metrics is available 48-96 hours after online publication and is updated daily on week days.
Initial download of the metrics may take a while.