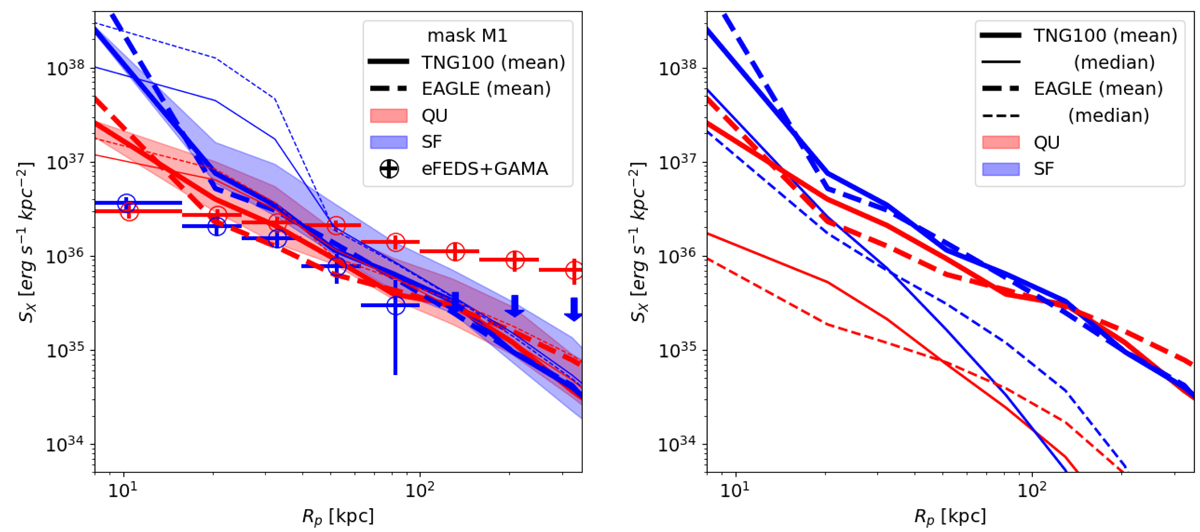
Fig. 9.
Download original image
Left: X-ray luminosity projected radial profiles (0.5–2.0 keV rest-frame) for the quiescent QU_M10.7 and the star-forming SF_M10.7 samples (as in Fig. 5 left panel), i.e., for central galaxies with median galaxy stellar mass of about 5 × 10¹⁰ M⊙ and median redshift 0.20. Their mass and redshift distributions are shown in Fig. 4. The profiles are compared to the results from the TNG100 (solid) and the EAGLE (dashed) simulations, consistently matched in stellar mass, sSFR, and redshift. Observed stacking results are compared to the mean simulated profiles (thick curves). For illustrative purposes, we convolve the mean predicted simulated profiles (thick curves) with the PSF (dashed lines in Fig. 5) and obtain the thin curves (ideally this should be done on each individual simulated galaxy profile before taking the mean). This provides a rough idea of how the flux in the inner regions is shifted to larger radii due to the PSF. Right: complete set of profiles predicted by the simulation: mean (thick lines) and median (thin lines). The median profiles show where the majority of the simulated profiles are located; the median curve is significantly lower than the mean curve. Shaded areas represent the systematic uncertainties associated to the extraction of the mocked observable from the simulations (specifically for TNG100); see text for details. We expect the possible systematic uncertainties to be similar for the EAGLE simulation, but we refrain from adding shaded areas in order to avoid overcrowding the figure.
Current usage metrics show cumulative count of Article Views (full-text article views including HTML views, PDF and ePub downloads, according to the available data) and Abstracts Views on Vision4Press platform.
Data correspond to usage on the plateform after 2015. The current usage metrics is available 48-96 hours after online publication and is updated daily on week days.
Initial download of the metrics may take a while.