Fig. 8.
Download original image
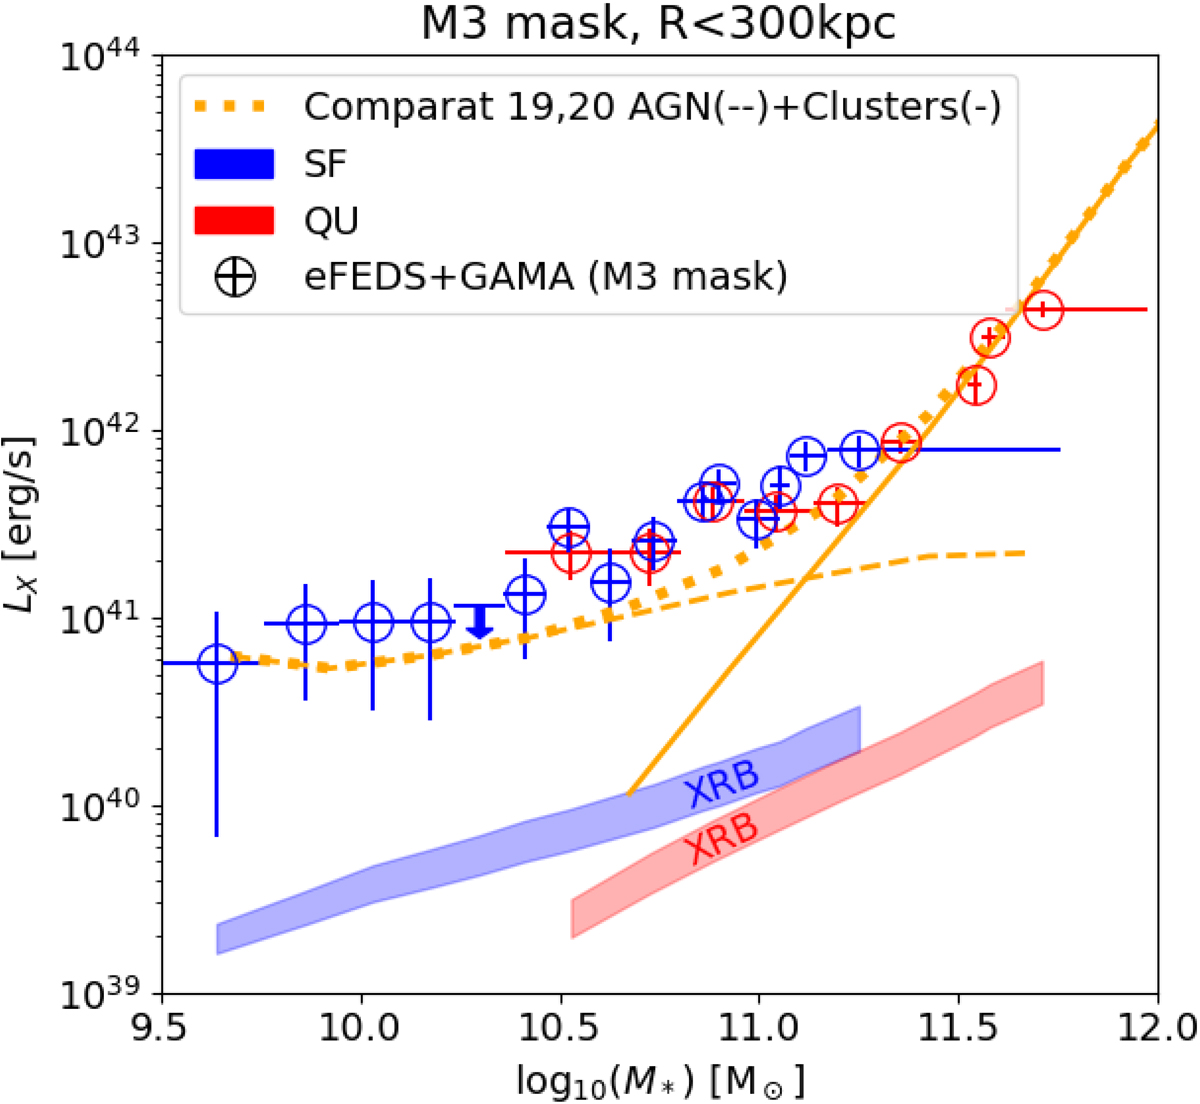
Same as Fig. 7 but for the M3 mask (i.e., including detected point sources). Predictions based on the empirical AGN and cluster models from Comparat et al. (2019); Comparat et al. (2020a) (now including sources with FX > 6.5 × 10⁻¹⁵ erg s−1 cm−2, as per M3 mask) are shown as an orange dashed line (AGN) and a solid orange line (groups and clusters) and its sum (thick dotted orange line). The agreement between model and observations is remarkable. For stellar masses between 2 × 10¹⁰ M⊙ and 2 × 10¹¹ M⊙, the positive offset between the observations and models is likely related to a combination of emission from the CGM and projection effects.
Current usage metrics show cumulative count of Article Views (full-text article views including HTML views, PDF and ePub downloads, according to the available data) and Abstracts Views on Vision4Press platform.
Data correspond to usage on the plateform after 2015. The current usage metrics is available 48-96 hours after online publication and is updated daily on week days.
Initial download of the metrics may take a while.