Fig. 7.
Download original image
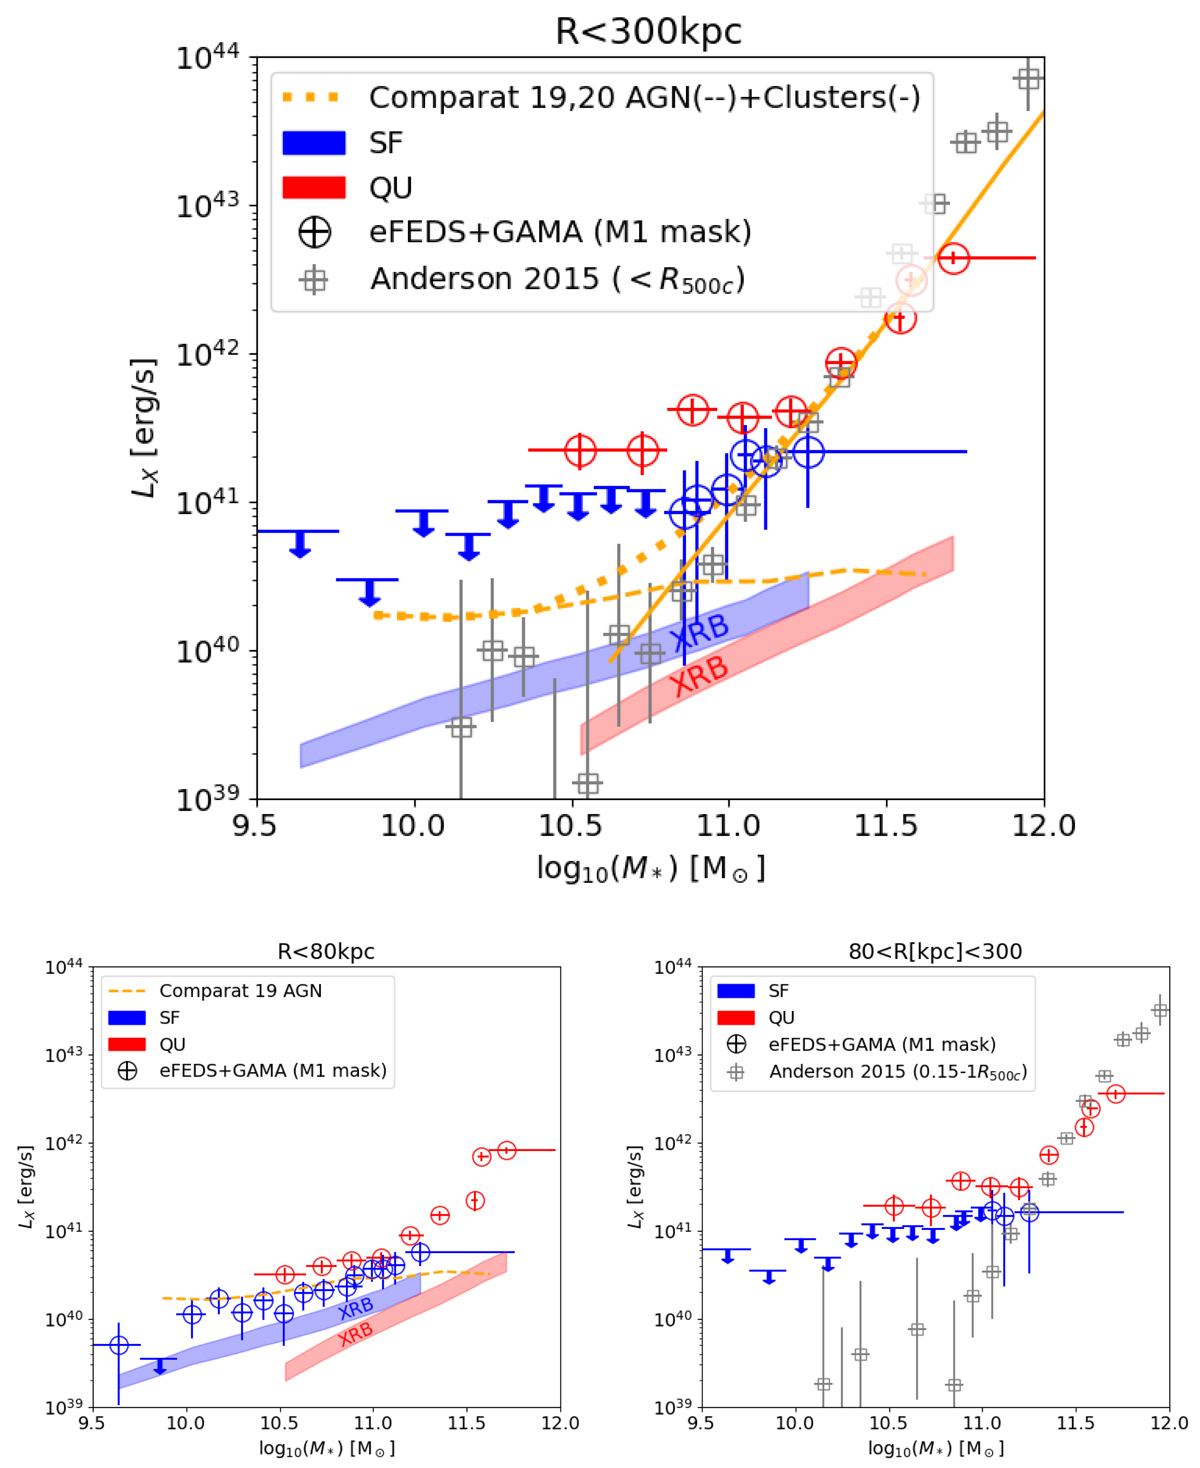
X-ray 0.5–2 keV projected luminosity around central galaxies as a function of galaxy stellar mass and split into star-forming (blue symbols and annotations) and quiescent (red) samples, computed using the M1 mask. Each eFEDS+GAMA detection is indicated with circles, upper limits with downwards arrows. In the main panel, we show the luminosity integrated within 300 physical projected kpc. In the bottom left panel, we show the luminosity integrated within 80 physical projected kpc. In the bottom right panel, the relation is shown for the outer shell 80–300 projected kpc. Gray squares are the measurements from Anderson et al. (2015), computed within R500c (main panel) and within 0.15–1R500c (bottom right panel). The orange dashed line shows the prediction from the AGN population synthesis model (after excluding sources with FX > 6.5 × 10⁻¹⁵ erg s−1 cm−2, as per M1 mask) of Comparat et al. (2019). The orange solid line shows the prediction for the clusters and groups using the model of Comparat et al. (2020a), i.e., the contribution of hot virialized haloes. The dotted line is the sum of the two.
Current usage metrics show cumulative count of Article Views (full-text article views including HTML views, PDF and ePub downloads, according to the available data) and Abstracts Views on Vision4Press platform.
Data correspond to usage on the plateform after 2015. The current usage metrics is available 48-96 hours after online publication and is updated daily on week days.
Initial download of the metrics may take a while.