Fig. 3.
Download original image
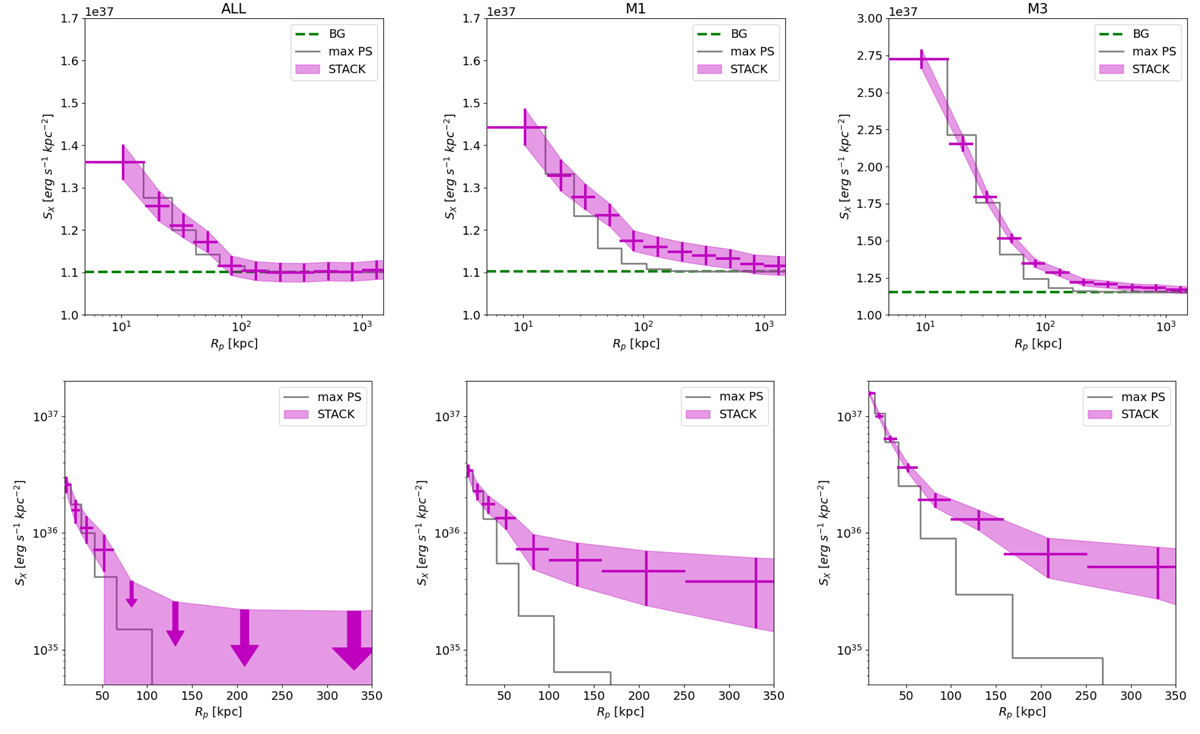
Measured X-ray radial projected luminosity profiles (0.5–2.0 keV rest-frame) for the ALL_M10.7 GAMA central galaxy sample (‘STACK’, magenta crosses and shaded area). Each panel shows the result when a different mask is applied to the set of events: “ALL” (left), “M1” (middle), and “M3” (right). We note the variation in the y-axis range in different panels. The green dashed line represents the background level, estimated as discussed in Sect. 3.4. The profile shape expected if all sources stacked were point-like is shown with a gray line labeled “max PS”. The bottom series of panels shows the background-subtracted profiles with a linear radial scale extending to 300 kpc.
Current usage metrics show cumulative count of Article Views (full-text article views including HTML views, PDF and ePub downloads, according to the available data) and Abstracts Views on Vision4Press platform.
Data correspond to usage on the plateform after 2015. The current usage metrics is available 48-96 hours after online publication and is updated daily on week days.
Initial download of the metrics may take a while.